Figure 5.
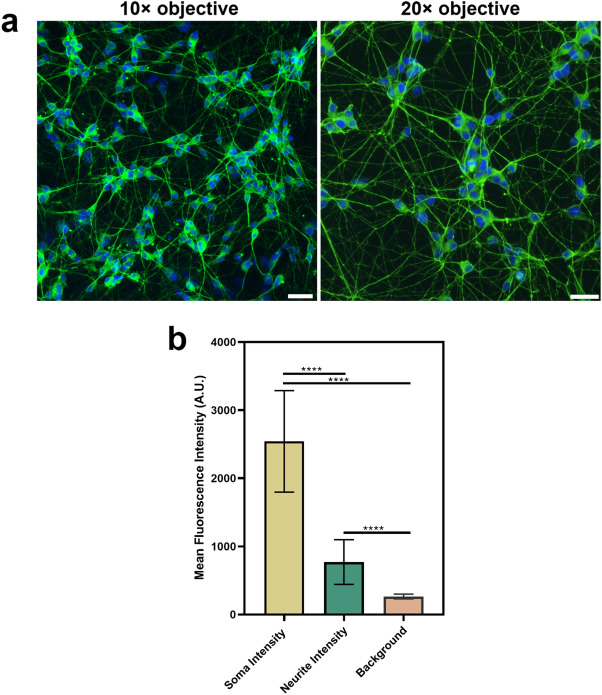
Image acquisition for neurite outgrowth analysis. (a) Comparison of images at ×10 (left) and ×20 (right) magnification (scale bars = 25 µm). Differentiated SH-SY5Y cells were labelled with βIII-tubulin and a Hoechst nuclear counterstain. βIII-tubulin images were acquired using the GFP filter (excitation 482/25 nm; emission 524/24 nm), while Hoechst nuclei images were acquired using the DAPI filter (excitation 357/44 nm; emission 447/60 nm). Although the ×10 objective increases the number of cells in the field of view, it is more difficult to visualise finer neurite processes. The ×20 objective acquires images with a higher resolution to distinguish these features. (b) Differences in mean fluorescence intensity of βIII tubulin between the soma, neurites and background. Analysis was performed on images acquired using a ×20 objective. Each bar represents the mean (n = 250 points) ± SD. A one-way ANOVA test and Tukey’s post-hoc analysis was performed to evaluate statistical significance where ****p < 0.0001.

