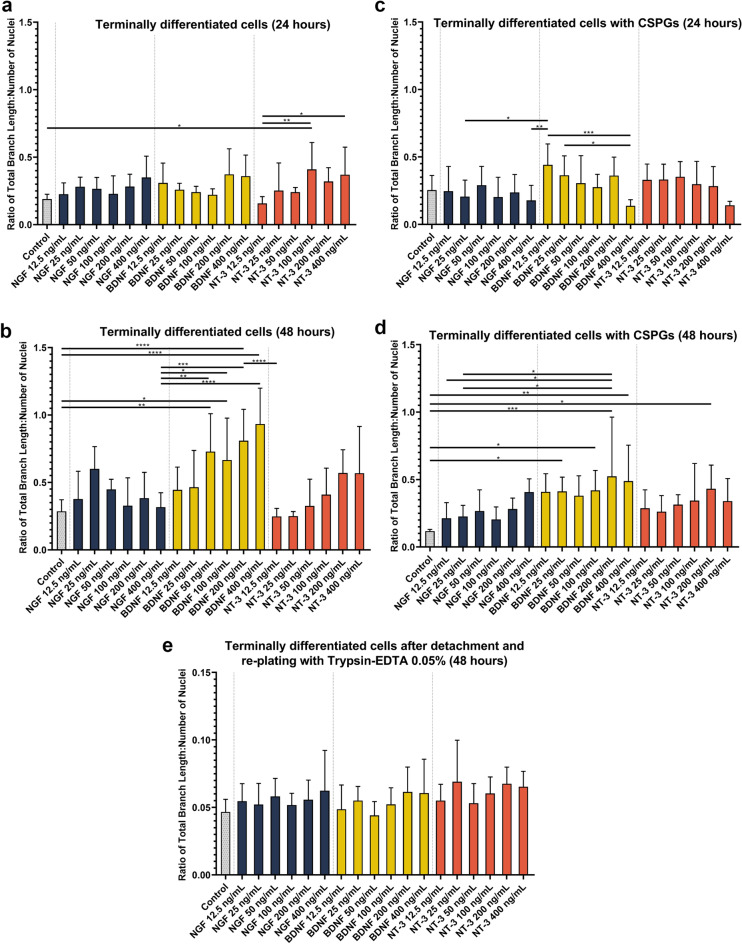
Figure 6.
Neurite outgrowth quantification in response to treatment with NGF, BDNF or NT-3. (a) Terminally differentiated cells incubated with neurotrophin medium for 24 h and (b) Terminally differentiated cells incubated with neurotrophin medium for 48 h. (c) Terminally differentiated cells incubated with neurotrophin medium and 10 µg/mL CSPG for 24 h. (d) Terminally differentiated cells incubated with neurotrophin medium and 10 µg/mL CSPG for 48 h. (e) Terminally differentiated cells re-plated with trypsin–EDTA (0.05%) and incubated with neurotrophin medium and 10 µg/mL CSPG for 48 h. Each bar represents the mean ± SD. A one-way ANOVA test and Tukey’s post-hoc analysis was performed to evaluate statistical significance where ****p < 0.0001, ***p < 0.001, **p < 0.01 and *p < 0.05.

