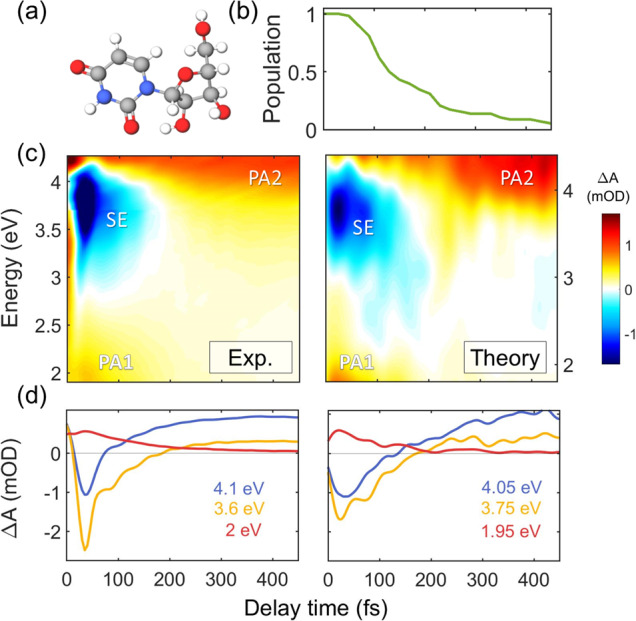
Fig. 1. Excited state dynamics of uridine.

a Molecular structure of Urd. b Time-dependent excited state population calculated by QM/MM simulations. c Experimental (left) and computed (right) TA maps of Urd. Two photo-induced absorption bands (labeled PA1 and PA2) and a stimulated emission (SE) band can be identified. d TA dynamics at selected probe photon energies; signal intensity reported as differential optical density ΔA in mOD units. Source data are provided as a Source Data file.
