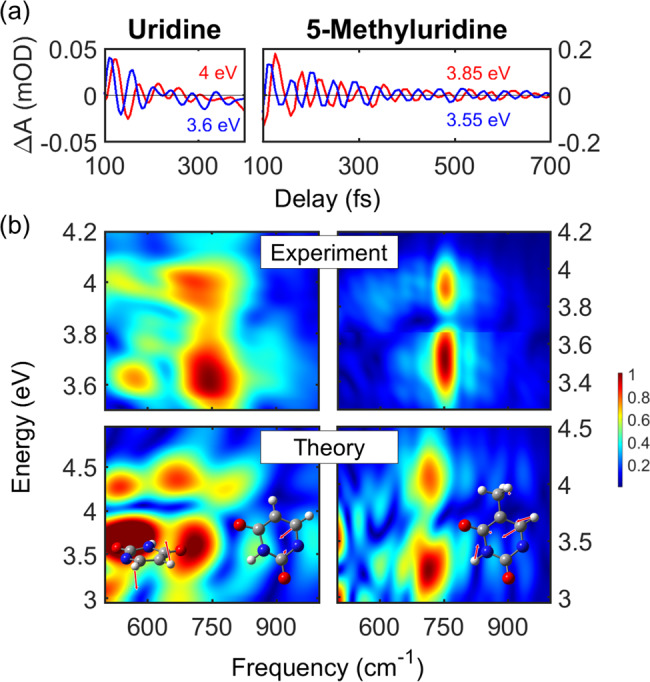
Fig. 3. Coherent vibrations in pyrimidines.

a Oscillatory patterns were obtained after subtraction of the slowly varying component from the transient spectra maps by employing a bandpass Fourier filter. Two examples of the extracted oscillatory dynamics are shown for Urd (left panel) and 5mUrd (right panel). Signal intensity reported as differential optical density ΔA in mOD units. b Comparison of the experimental and theoretical two-dimensional Fourier transform maps of the residuals (oscillations) for Urd (left panels) and 5mUrd (right panels; the color jump in the experimental map is due to the merge of the two measurements corresponding to two different probe spectral regions). Inset left panel: schemes of the 600 cm−1 (left) and 750 cm−1 (right) vibrational modes in Urd. Inset right panel: scheme of the 750 cm−1 vibrational mode in 5mUrd. Source data are provided as a Source Data file.
