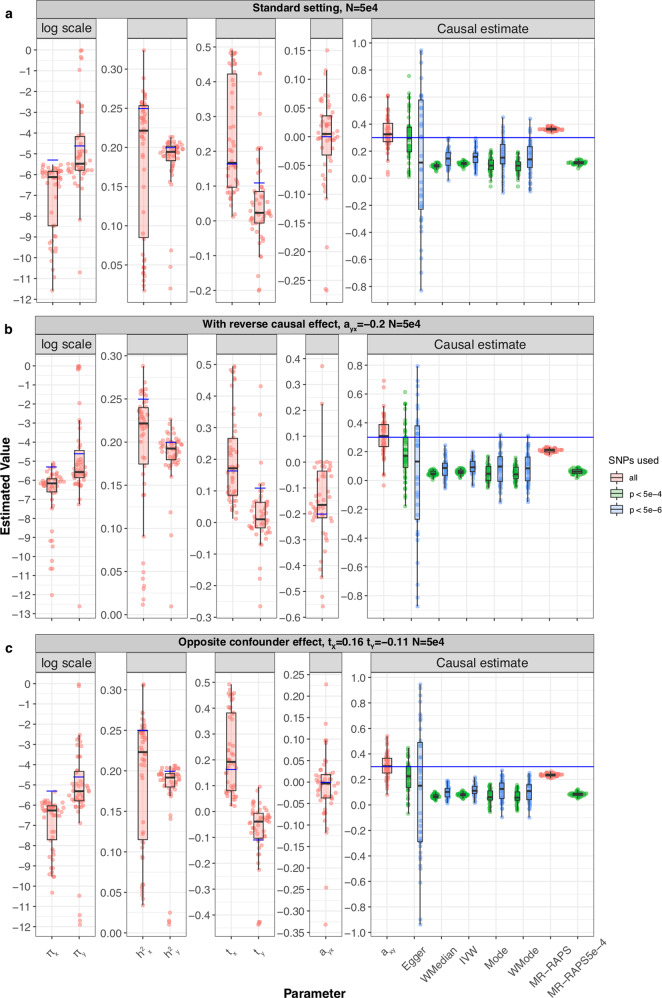
Fig. 2. Simulation results under various scenarios.
These modified Sina-boxplots represent the distribution of parameter estimates from 50 different data generations under various conditions. For each generation, standard MR methods as well as our LHC-MR were used to estimate a causal effect. In the boxplots, the lower and upper hinges correspond to the first and third quartiles, the middle bar corresponds to the median, whereas the upper whisker is the largest dataset estimate smaller than 1.5×inter-quartile range above the third quartile. The lower whisker is defined analogously. The true values of the parameters used in the data generations are represented by the blue dots/lines. a Estimation under standard settings (). b Addition of a reverse causal effect αy→x = −0.2. c Confounder with opposite causal effects on X and Y (tx = 0.16, ty = −0.11).

