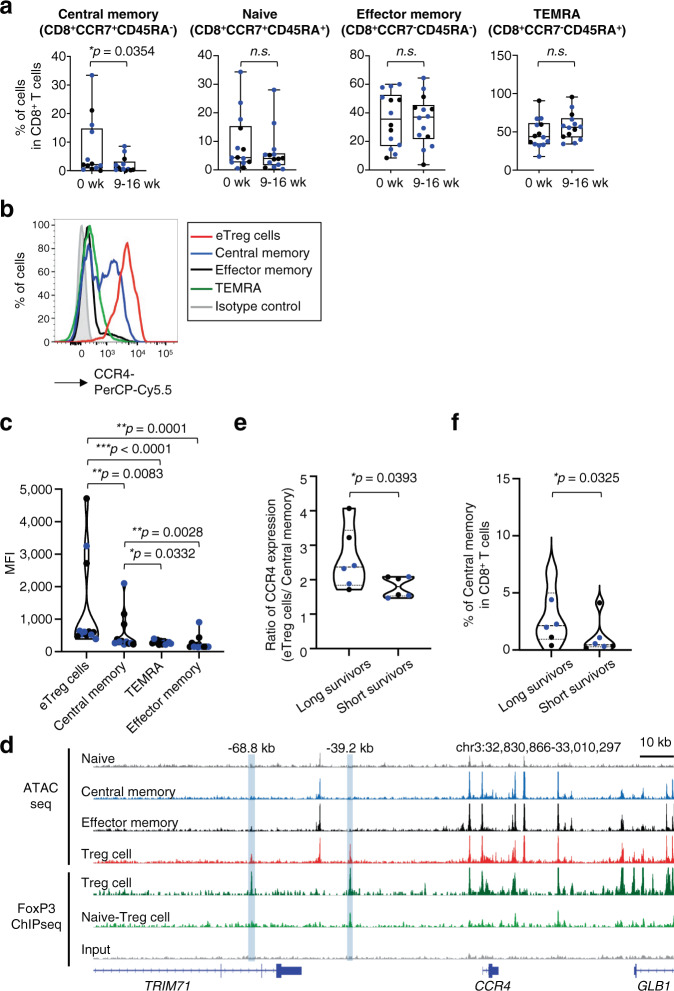
Fig. 4. Central memory CD8+ T cells with CCR4 expression are decreased after mogamulizumab treatment.
a Summaries for the frequencies of each CD8+ T cell fraction (central memory CD8+ T cells, *p = 0.0354) as depicted in Fig. 2f at pre- and post-mogamulizumab treatment are shown. PBMC samples (n = 14), as in Fig. 2, were subjected to flow cytometry. b, c Representative flow cytometry staining for CCR4 in each CD8+ T cell fraction in comparison with that in eTreg cells (b) and summary for the CCR4 expression levels (MFI) in central memory CD8+ T cells (to eTreg cells, **p = 0.0083), effector-memory CD8+ T cells (to eTreg cells, **p = 0.0001 and to central memory CD8+ T cells, **p = 0.0028), TEMRA CD8+ T cells (to eTreg cells, ***p < 0.0001 and to central memory CD8+ T cells, *p = 0.0332) and eTreg cells (c) are shown (n = 12). Red line, eTreg cells; blue line, central memory CD8+ T cells; black line, effector-memory CD8+ T cells; green line, TEMRA CD8+ T cells; filled gray area, control staining. d Sequencing tracks of ATAC-seq regarding four T cell subsets (naive CD8+ T cells, central memory CD8+ T cells, effector-memory CD8+ T cells and Treg cells) and FoxP3 ChIP-seq about Treg cells around the CCR4 gene locus. The normalized ATAC-seq and ChIP-seq read coverage were used to visualize the tracks. ATAC seq about each T cell subset (gray: naive CD8+ T cells, blue: central memory CD8+ T cells, black: effector-memory CD8+ T cells, red: Treg cells) and FoxP3 ChIP-seq about Treg cells (green: Treg cells, light green: naive Treg cells, grey: IP control) are shown. e Ratio of CCR4 expression levels (mean fluorescence intensity: MFI) in central memory CD8+ T cells to eTreg cells (*p = 0.0393) in long survivors (≥1 year, n = 6) and short survivors (< 1 year, n = 6) is shown. f The frequency of central memory CD8+ T cells in CD8+ T cells after mogamulizumab treatment (*p = 0.0325) in long survivors and short survivors is shown (n = 6). In (a, c, e and f), black dots, patients who received 1.0 mg/kg mogamulizumab; blue dots, patients who received 0.1 mg/kg mogamulizumab. In (a and c), two-sided, (e and f), one-sided Mann–Whitney test was used. In a, the center line indicates the median, and the box limits indicate the 1st and 3rd quartiles. The whiskers go down to the smallest value and up to the largest. week: wk, naive CD8+ T cells: Naive, central memory CD8+ T cells: Central memory, effector-memory CD8+ T cells: Effector memory, TEMRA CD8+ T cells: TEMRA. *p < 0.05, **p < 0.005, ***p < 0.0001. Source data are provided as a Source Data file.

