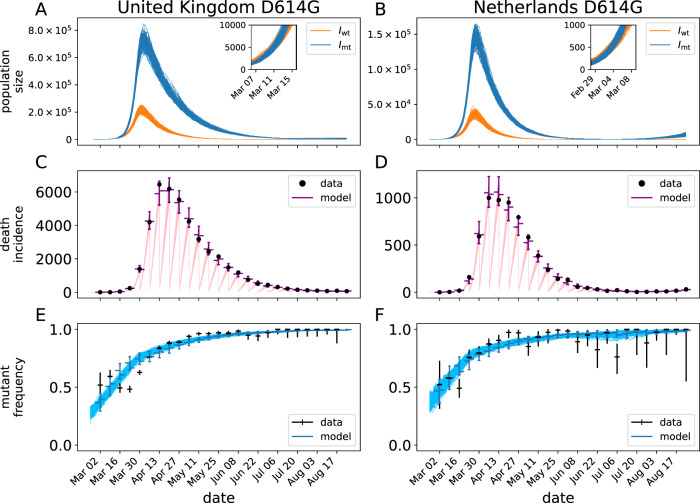
Fig. 2. Mechanistic model fit to D614G data in the Netherlands, and UK.
Panels A and B show realizations of the prevalence of the background, Iwt, and D614G variant, Imt for the maximum-likelihood model fit. The insets show a close-up of the first weeks of the epidemics. Panels C and D show the number of deaths accumulated up to the week scale (black dots) and the model fits to those data. The colored bars indicate the 95% predictive interval for the data according to the stochastic model. The ticks on the left of the bar show the median of this distribution, while the ticks on the right show the median weighted by the likelihood of the data. Panels E and F show the proportion of sequenced genomes with a glycine on position 614 of the spike protein in a given week. The blue curves are realizations of the model fit to the data. Black, vertical bars on the data indicate the 95% CI for the proportion based on the number of sampled genomes (assuming binomial sampling). In total, 26874 and 2045 sequences were used for UK and Netherlands, respectively. In all panels, we show 100 realizations of the stochastic model.

