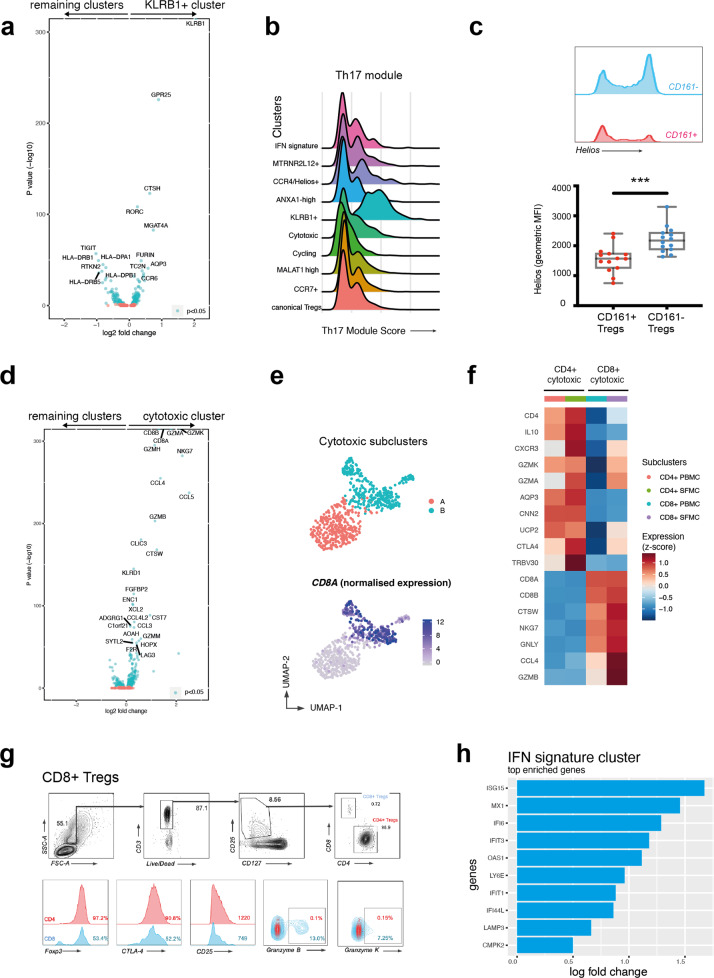
Fig. 2. Ankylosing spondylitis Treg subsets include a Th17-like subset and a cytotoxic subset that contains a CD8-expressing regulatory phenotype.
a Volcano plot shows differential gene expression of KLRB1+ Tregs compared to all other memory Tregs. Blue dots indicate p < 0.05, Wilcoxon’s rank-sum test with Bonferroni correction. b KLRB1+ cluster highly expresses a Th17-like gene module. Distribution of gene score obtained from a curated Th17 gene list (see Supplementary Table 4) across the various clusters in the form of ridge plot. c Representative FACS plot showing Helios expression from Th17-like memory Tregs (CD25+CD127lowCD45RA−CCR6+) and remaining memory Tregs from an AS patient blood, and Helios expression (geometric mean of fluorescence intensity) in Tregs from 14 SpA PBMCs (gated on CD4+ CD25+ CD127low). ***p < 0.001, Mann–Whitney test. d Volcano plot showing differential gene expression of Cytotoxic Tregs compared to all other Treg clusters. Blue dots indicate p < 0.05, Wilcoxon’s rank-sum test with Bonferroni correction. e After reclustering cytotoxic Tregs, two subclusters appear (top panel). CD8A expression shown in bottom panel. f Heatmap of row-wise z-score-normalized mean expression of selected marker genes in CD4+ and CD8+ subclusters. g CD8+ Treg identification and phenotype on flow cytometry: CD8+ Tregs (defined as CD3+ CD8+ CD4− CD25+ CD127low). Representative flow cytometry plots from PBMCs of one of n = 8 SpA patients. h Top ten upregulated genes in IFN signature cluster.

