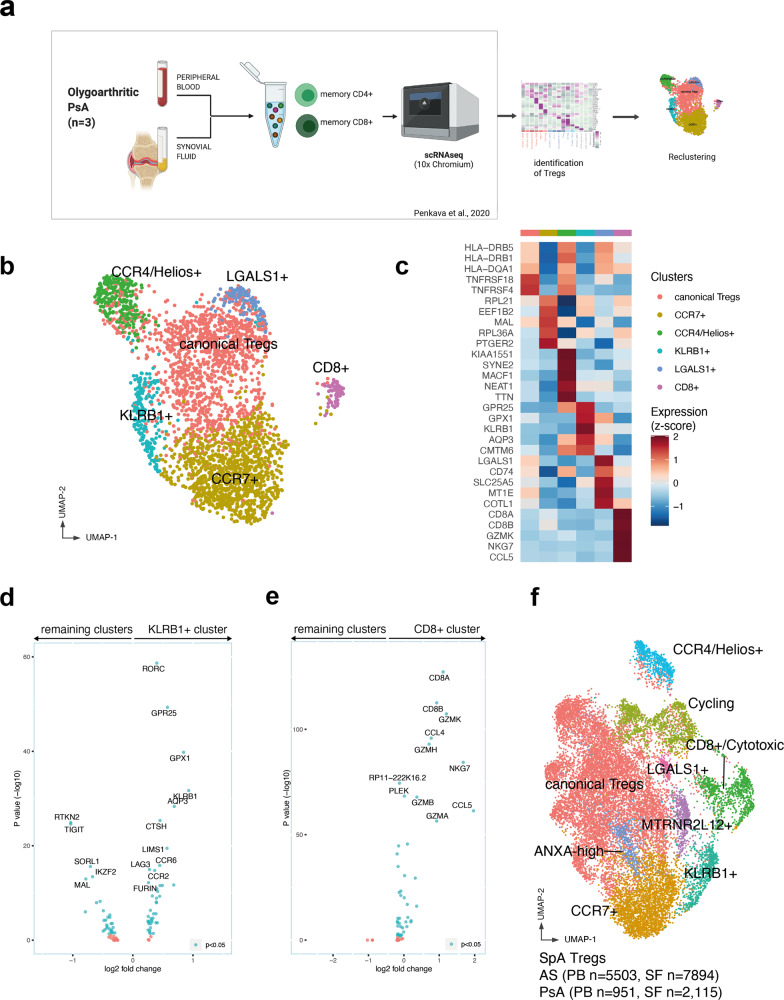
Fig. 3. Parallel single-cell RNAseq analysis of psoriatic arthritis blood and synovial fluid Tregs confirms regulatory subset identities and gene signatures.
a Experimental workflow. The Treg dataset was obtained from ref. 15 identifying the cluster representing Tregs. Figure generated using Biorender. b UMAP visualization of 3066 Tregs from peripheral blood and synovial fluid obtained from three PsA patients. c PsA Treg clusters and their differentially expressed genes. Shown is a heatmap of row-wise z-score-normalized mean expression of selected marker genes, chosen between top differentially expressed for each cluster. d, e Differentially expressed genes in KLRB1+ cluster (d) and CD8+ cluster (e) identified in the PsA dataset compared to the remaining Tregs. Blue dots indicate p < 0.05, Wilcoxon’s rank-sum test with Bonferroni correction. f UMAP plot depicting integrated AS and PsA Treg datasets demonstrating common and overlapping identities.

