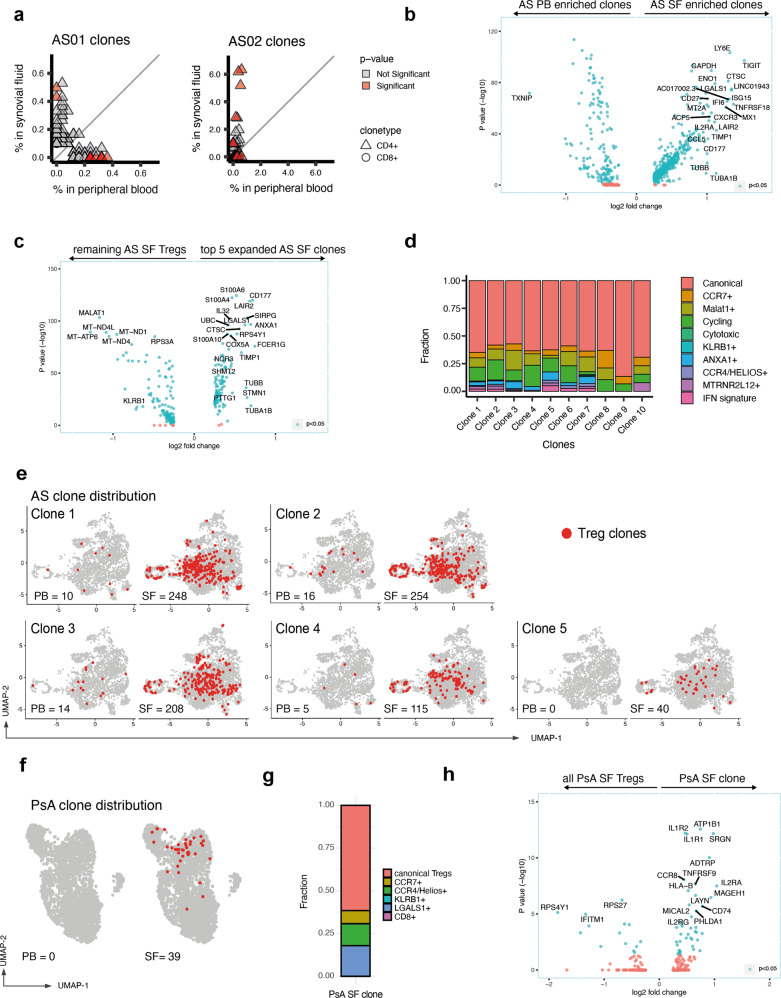
Fig. 5. Clonally expanded Tregs with identical TCRα/β sequences and distinct transcriptional features are expanded in the synovial fluid and are present in multiple Treg clusters.
a Individual clonal expansion across peripheral blood (PB) and synovial fluid (SF) for two AS patients. Triangles represent CD4 clonotypes. Circles represent CD8 clonotypes. Scatter graphs only display clones where at least three cells are present in either PB or SF. Data points colored red show significantly expanded clonotypes (adjusted p-value ≤ 0.05). Two-sided Fisher’s exact test, Benjamini–Hochberg correction. b Differential gene expression of SF-enriched compared with PB-enriched clones. Genes with log fold change >0.25 (and <−0.25) are shown. Genes with adjusted p-value < 0.05 (Wilcoxon’s rank-sum test with Bonferroni correction) are colored in blue. TCR variable chain genes have been removed (full data in Supplementary Data 7). c Differential gene expression of the top five SF-enriched clonotypes (ranked by p-value, two-sided Fisher’s exact test, Benjamini–Hochberg correction) compared to the remaining, non-clonal SF Tregs. d Cluster assignment of Treg clones enriched in AS synovial fluid. e UMAP plots of AS Tregs showing the top five expanded AS clones in red, together with clonal numbers in PB and SF. f Distribution of the single expanded PsA clone on the PsA UMAP plot. g Distribution of the PsA clone to each PsA cluster. h Differential gene expression of PsA clone vs. non-clonal SF Tregs.

