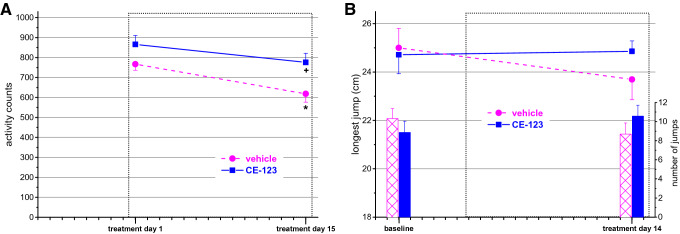
Figure 1.
Spontaneous motor activity (A) and performance in the pot jumping test (B) of animals repeatedly treated with CE-123 or vehicle. (For the study design see “Methods and materials”). Data are expressed as mean ± SEM. Scaling of X-axis reflects calendar days. Dotted rectangle signs the treatment period. (A): Activity counts detecting horizontal movements. (B): Upper curves, left axis: longest distance jumped; lower columns, right axis: total number of jumps in the trial. *p < 0.05 significance of the difference from the first measurement in the same group. +p < 0.05 significance of the difference between groups on the same day (repeated measures ANOVA followed by Duncan test).

