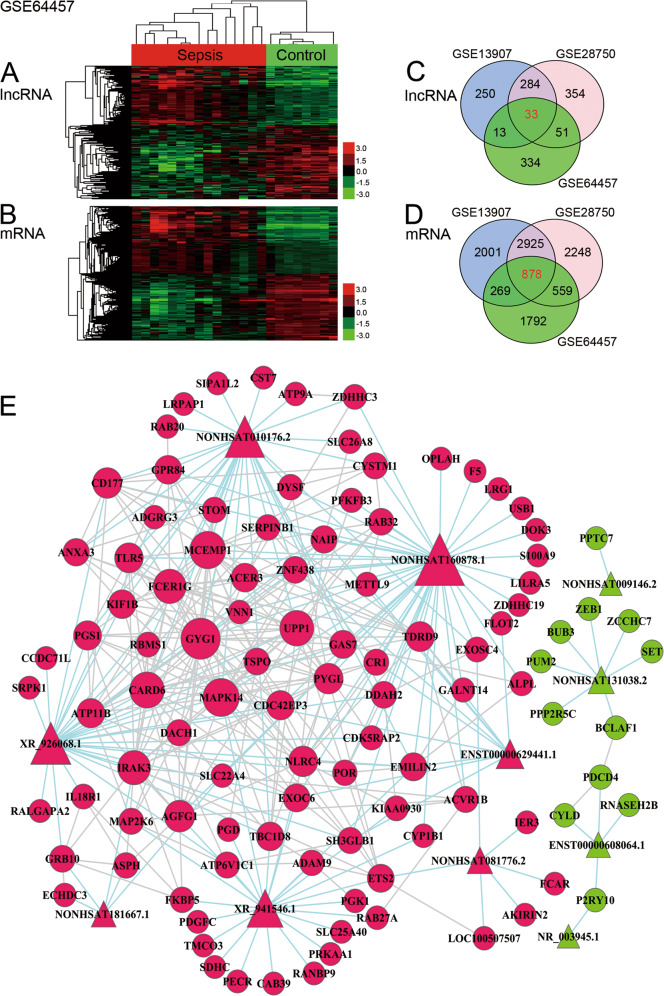
Fig. 1. Identification of differentially expressed lncRNAs and mRNAs in the immunocytes of septic patients.
A Heat map of 431 differentially expressed lncRNAs (including 192 upregulated and 239 downregulated lncRNAs) identified in the microarrays in the GSE64457 dataset. B Heat map of 3498 differentially expressed mRNAs (including 1765 upregulated and 1733 downregulated mRNAs) identified in the microarrays in the GSE64457 dataset. C Venn plot of the 1319 differentially expressed lncRNAs in the 3 datasets. D Venn plot of the 10,672 differentially expressed mRNAs in the 3 datasets. E Co-expression network of the significantly differentially expressed lncRNAs and mRNAs. Circles indicate mRNAs and triangles indicate lncRNAs. Red represents upregulated expression and green represents downregulated expression. Baby blue lines indicate the interaction between lncRNAs and mRNAs, and gray lines indicate mRNAs interacting with other mRNAs.

