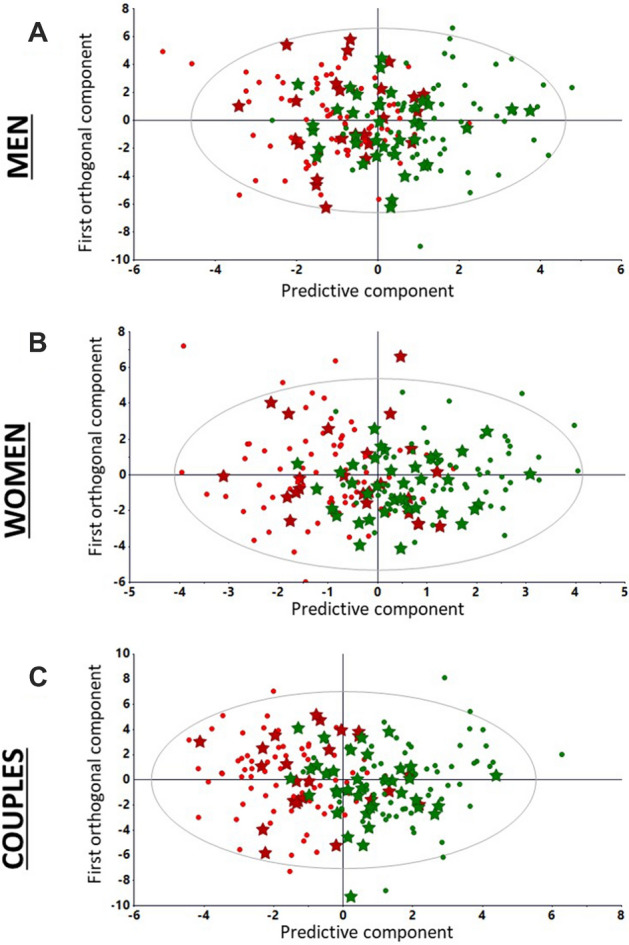
Figure 2.

Orthogonal partial least squares discriminant analysis models (training and evaluation) calculated from men, women and couples development sets. (A) External evaluation of men fertility status: labelled external test set observations (fertile and infertile as green and red stars, respectively) are projected on the score plots generated from fertile (green dots) and infertile (red dots) men (135 × 50) set. R2 (fit) and Q2 (prediction capability) are 0.471 and 0.322, respectively. (B) External evaluation of women fertility status: labelled external test set observations (fertile and infertile as green and red stars, respectively) are projected on the score plots generated from fertile (green dots) and infertile (red dots) women (135 × 30) development set. R2 and Q2 were 0.560 and 0.462. (C) External evaluation of couples: labelled external test set observations (fertile and infertile as green and red stars, respectively) are projected on the score plots generated from fertile (green dots) and infertile (red dots) couples (135 × 80) development set. R2 and Q2 were 0.624 and 0.487. Accuracy scores are 0.590, 0.574 and 0.688 for models based on men, women and couples data, respectively.
