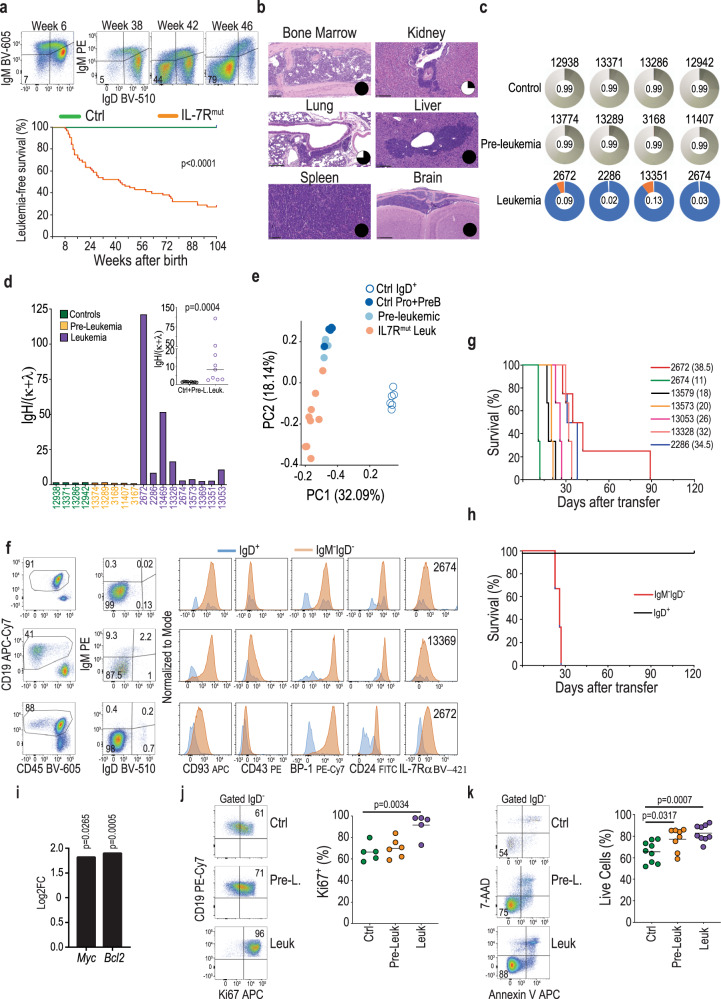
Fig. 2. IL-7Rα mutant mice develop precursor B-ALL.
a Example of IgM−IgD− cell frequency evolution in a mouse that developed leukemia (top). Kaplan–Meier leukemia-free survival curves of control (Ctrl; n = 40) and IL7R mutant (IL7Rmut; n = 63) animals (bottom). All mice died with precursor B-ALL. Log-rank Mantel–Cox test (b) Histologies (H&E) of organs infiltrated with leukemia cells. Pie chart inserts represent fraction of analyzed animals (n = 4) with leukemia involvement (in black) in the respective organ. Scale bar indicates 100 μm (bone marrow, spleen), 250 μm (kidney, lung, liver), or 500 μm (brain). c Clonality pie charts based on IgH sequencing. Each colored slice corresponds to a clone, indicative of clonality. Gray areas correspond to many rare clones, indicative of polyclonality. Equitability values (ranging from 0, for monoclonality, to 1, for a balanced repertoire) are shown in the center of the pie charts. Samples are bone marrow pro+pre-B cells from control, pre-leukemic, or leukemic mice. d Ig heavy chain (H) over light chain (κ and λ) ratios to evaluate, at the population level, the presence of the pro-B cell rearrangement signature (heavy chain expression in the absence of light chain expression). Two-tailed Mann–Whitney test performed. e Principal component analysis of normal (Ctrl Pro+Pre-B) and pre-leukemic (Pre-leukemic) pro- and pre-B cell precursors, mature splenic B cells (Ctrl IgD+) and leukemia cells (IL7Rmut Leuk). f Immunophenotypic analysis of three representative BM leukemia samples. Numbers inside dot plots indicate frequency in each quadrant or region. g, h Kaplan–Meier leukemia-free survival curves of mice transplanted with g bulk primary leukemias or h sorted IgD+ versus IgM−IgD− leukemia cells. i Myc and Bcl2 transcript upregulation (log2 fold change) in leukemia samples (n = 9) as compared to normal controls (n = 5). Moderated t-test performed. j Frequency of Ki67-positive cells in controls (n = 5), pre-leukemia (n = 5), and leukemia samples (n = 5). Dot plots are representative of each condition. k Frequency of annexin V/7AAD-negative (viable) cells in controls (n = 9) pre-leukemia (n = 8) and leukemia samples (n = 9). Dot plots are representative of each condition. j, k Two-tailed unpaired t-test. Source data are provided as a Source Data file.

