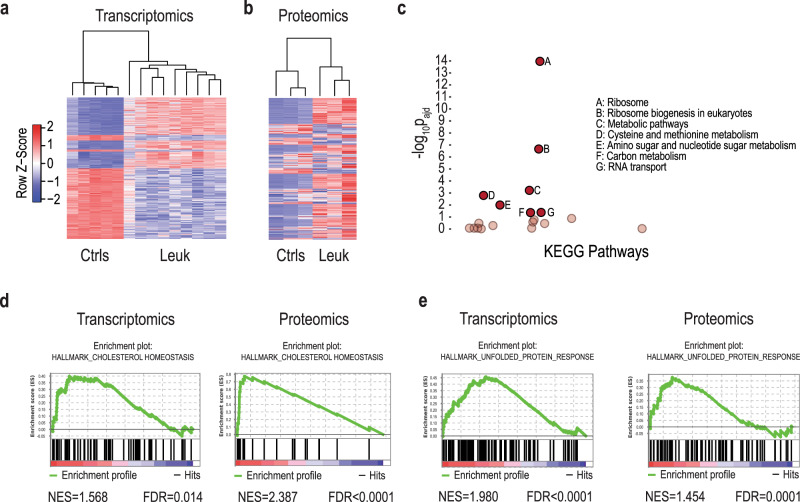
Fig. 3. Transcriptomics and proteomics characterization of mutant IL7R leukemias.
a Heatmap representation and hierarchical clustering of control and leukemia samples based on the 1000 most significant (adj. p value) differentially expressed genes. b Heatmap representation of samples based on the 500 most significant (nominal p value) differentially expressed proteins between control and leukemia samples. c g:Profiler KEGG pathway functional enrichment analysis for significant and concordantly upregulated genes and proteins in leukemia samples. Significantly enriched pathways (A–G, adj. p < 0.05. Cumulative hypergeometric test) are represented in full opacity. Pathways below the significance threshold are represented in low opacity. Pathways where p = 1 are not featured. d, e Gene set enrichment analysis (GSEA)-enrichment plot of differential gene and protein expression between leukemias and controls showing a significant upregulation of the d cholesterol homeostasis and the e unfolded protein response (UPR) hallmark gene sets (normalized enrichment score (NES) > 1, FDR < 0.05). Source data are provided as a Source Data file.

