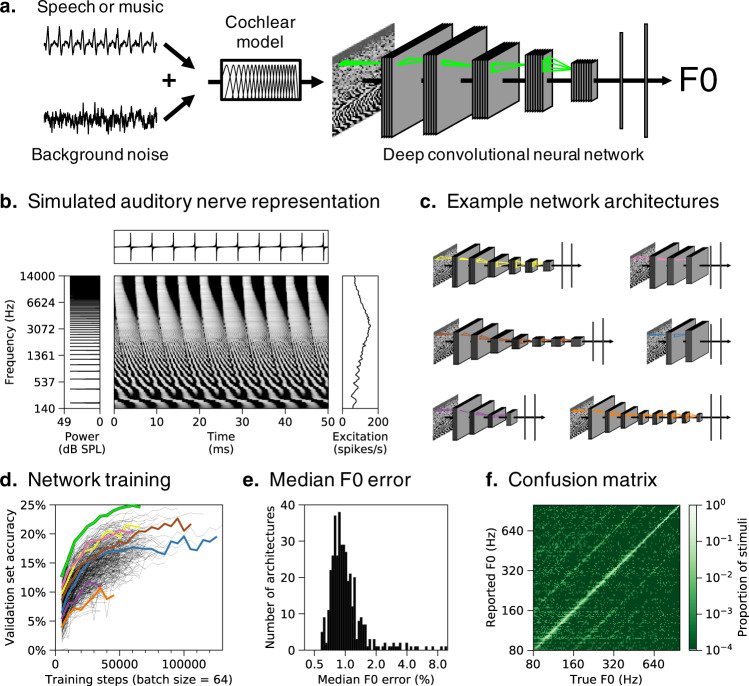
Fig. 1. Pitch model overview.
a Schematic of model structure. DNNs were trained to estimate the F0 of speech and music sounds embedded in real-world background noise. Networks received simulated auditory nerve representations of acoustic stimuli as input. Green outlines depict the extent of example convolutional filter kernels in time and frequency (horizontal and vertical dimensions, respectively). b Simulated auditory nerve representation of a harmonic tone with a fundamental frequency (F0) of 200 Hz. The sound waveform is shown above and its power spectrum is shown to the left. The waveform is periodic in time, with a period of 5ms. The spectrum is harmonic (i.e., containing multiples of the fundamental frequency). Network inputs were arrays of instantaneous auditory nerve firing rates (depicted in greyscale, with lighter hues indicating higher firing rates). Each row plots the firing rate of a frequency-tuned auditory nerve fiber, arranged in order of their place along the cochlea (with low frequencies at the bottom). Individual fibers phase-lock to low-numbered harmonics in the stimulus (lower portion of the nerve representation) or to the combination of high-numbered harmonics (upper portion). Time-averaged responses on the right show the pattern of nerve fiber excitation across the cochlear frequency axis (the “excitation pattern”). Low-numbered harmonics produce distinct peaks in the excitation pattern. c Schematics of six example DNN architectures trained to estimate F0. Network architectures varied in the number of layers, the number of units per layer, the extent of pooling between layers, and the size and shape of convolutional filter kernels d Summary of network architecture search. F0 classification performance on the validation set (noisy speech and instrument stimuli not seen during training) is shown as a function of training steps for all 400 networks trained. The highlighted curves correspond to the architectures depicted in a and c. The relatively low overall accuracy reflects the fine-grained F0 bins we used. e Histogram of accuracy, expressed as the median F0 error on the validation set, for all trained networks (F0 error in percent is more interpretable than the classification accuracy, the absolute value of which is dependent on the width of the F0 bins). f Confusion matrix for the best-performing network (depicted in a) tested on the validation set.

