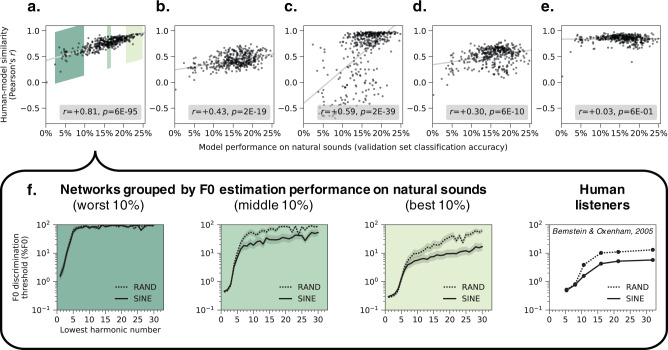
Fig. 3. Network architectures producing better F0 estimation for natural sounds exhibit more human-like pitch behavior.
a–e Plot human-model similarity in each experiment for all 400 architectures as a function of the accuracy of the trained architecture on the validation set (a set of stimuli distinct from the training dataset, but generated with the same procedure). The similarity between human and model results was quantified for each experiment as the correlation coefficient between analogous data points (Methods). Pearson correlations between validation set accuracy and human-model similarity for each experiment are noted in the legends. Each graph a–e corresponds to one of the five main psychophysical experiments (Fig. 2a–e): a F0 discrimination as a function of harmonic number and phase, b pitch estimation of alternating-phase stimuli, c pitch estimation of frequency-shifted complexes, d pitch estimation of complexes with individually mistuned harmonics, and e frequency discrimination with pure and transposed tones. f The results of the experiment from a (F0 discrimination thresholds as a function of lowest harmonic number and harmonic phase) measured from the 40 worst, middle, and best architectures ranked by F0 estimation performance on natural sounds (indicated with green patches in a). Lines plot means across the 40 networks. Error bars indicate 95% confidence intervals via bootstrapping across the 40 networks. Human F0 discrimination thresholds from the same experiment are re-plotted for comparison.

