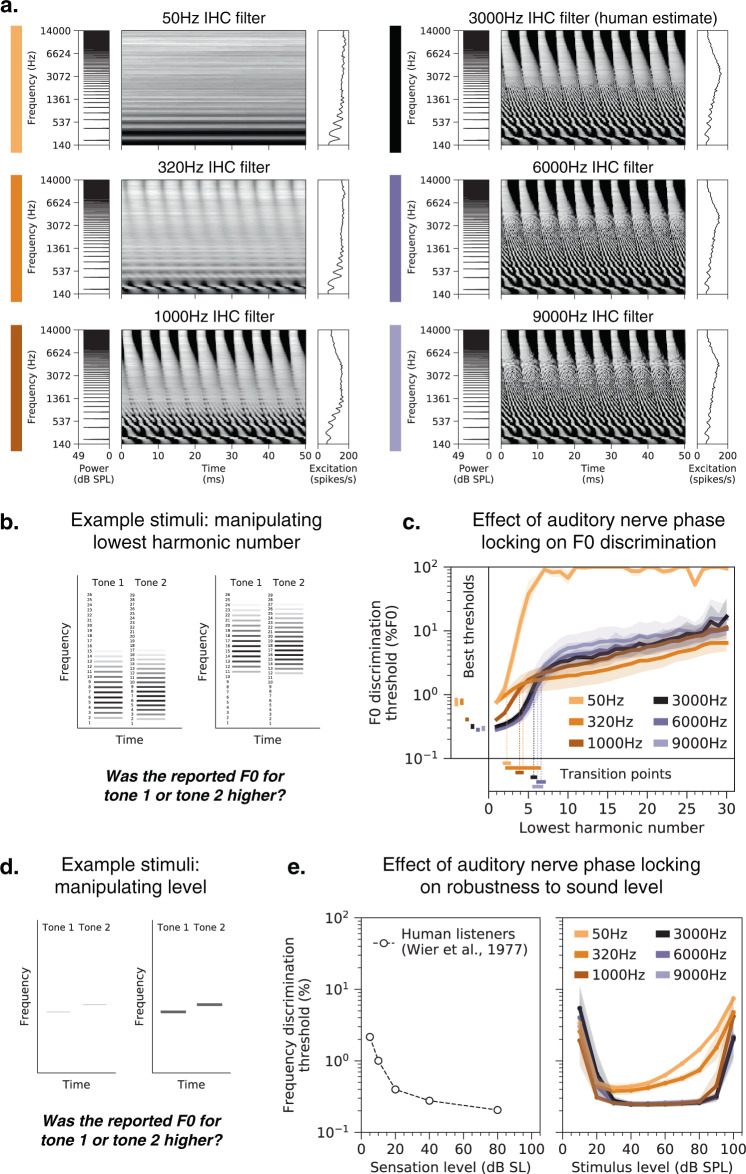
Fig. 5. Pitch perception is impaired in networks optimized with degraded spike timing in the auditory nerve.
a Simulated auditory nerve representations of the same stimulus (harmonic tone with 200 Hz F0) under six configurations of the peripheral auditory model. Configurations differed in the cutoff frequency of the inner hair cell lowpass filter, which sets the upper limit of auditory nerve phase locking. The 3000 Hz setting is that normally used to model the human auditory system. As in Fig. 1b, each peripheral representation is flanked by the stimulus power spectrum and the time-averaged cochlear excitation pattern. b Schematic of stimuli used to measure F0 discrimination thresholds as a function of lowest harmonic number. Gray level denotes amplitude. Two example trials are shown, with two different lowest harmonic numbers. c F0 discrimination thresholds as a function of lowest harmonic number measured from networks trained and tested with each of the six peripheral model configurations depicted in a. The best thresholds and the transition points from good to poor thresholds (defined as the lowest harmonic number for which thresholds first exceeded 1%) are re-plotted to the left of and below the main axes, respectively. Here and in e, lines plot means across the ten networks; error bars plot 95% confidence intervals, obtained by bootstrapping across the ten networks. d Schematic of stimuli used to measure frequency discrimination thresholds as a function of sound level. Gray level denotes amplitude. e Frequency discrimination thresholds as a function of sound level measured from human listeners (left) and from the same networks as c (right). Human thresholds, which are reported as a function of sensation level, are re-plotted from50.

