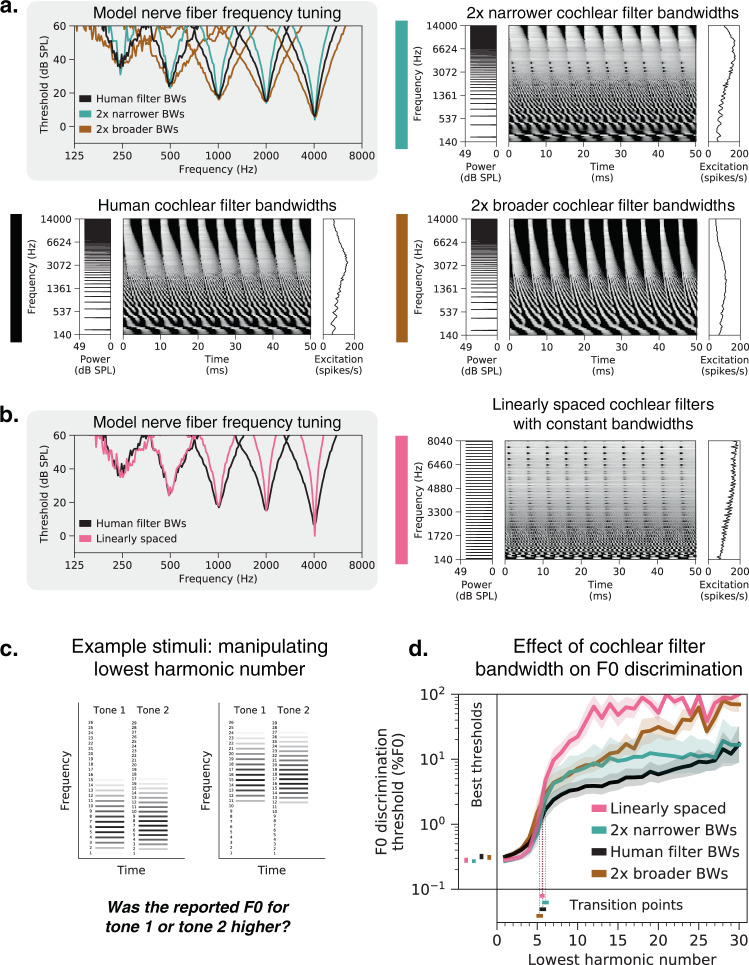
Fig. 6. Cochlear frequency tuning has relatively little effect on pitch perception.
a Cochlear filter bandwidths were scaled to be two times narrower or two times broader than those estimated for normal-hearing humans. This manipulation is evident in the width of auditory nerve tuning curves measured from five individual fibers per condition (upper left panel). Tuning curves plot thresholds for each fiber as a function of pure tone frequency. Right and lower left panels show simulated auditory nerve representations of the same stimulus (harmonic tone with 200 Hz F0) for each bandwidth condition. Each peripheral representation is flanked by the stimulus power spectrum and the time-averaged auditory nerve excitation pattern. The excitation patterns are altered by changes in frequency selectivity, with coarser tuning yielding less pronounced peaks for individual harmonics, as expected. b Cochlear filters modeled on the human ear were replaced with a set of linearly spaced filters with constant bandwidths in Hz. Pure tone tuning curves measured with linearly spaced filters are much sharper than those estimated for humans at higher frequencies (left panel; note the log-spaced frequency scale). The right panel shows the simulated auditory nerve representation of the stimulus from a with linearly spaced cochlear filters. In this condition, all harmonics are equally resolved by the cochlear filters and thus equally likely to produce peaks in the time-averaged excitation pattern. c Schematic of stimuli used to measure F0 discrimination thresholds. Gray level denotes amplitude. Two example trials are shown, with two different lowest harmonic numbers. d F0 discrimination thresholds as a function of lowest harmonic number, measured from networks trained and tested with each of the four peripheral model configurations depicted in a and b. The best thresholds and the transition points from good to poor thresholds (defined as the lowest harmonic number for which thresholds first exceeded 1%) are re-plotted to the left of and below the main axes, respectively. Lines plot means across the ten networks; error bars indicate 95% confidence intervals bootstrapped across the ten networks.

