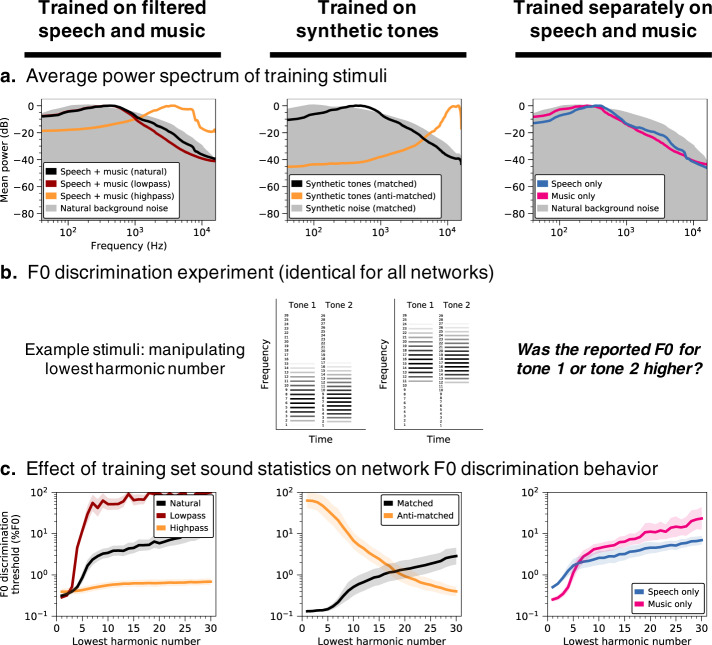
Fig. 7. Pitch perception depends on training set sound statistics.
a Average power spectrum of training stimuli under different training conditions. Networks were trained on datasets with lowpass- and highpass-filtered versions of the primary speech and music stimuli (column 1), as well as datasets of synthetic tones with spectral statistics either matched or anti-matched (Methods) to those of the primary dataset (column 2), and datasets containing exclusively speech or music (column 3). Filtering indicated in column 1 was applied to the speech and music stimuli prior to their superposition on background noise. Gray shaded regions plot the average power spectrum of the background noise that pitch-evoking sounds were embedded in for training purposes. b Schematic of stimuli used to measure F0 discrimination thresholds as a function of lowest harmonic number. Two example trials are shown, with two different lowest harmonic numbers. c F0 discrimination thresholds as a function of lowest harmonic number, measured from networks trained on each dataset shown in A. Lines plot means across the ten networks; error bars indicate 95% confidence intervals bootstrapped across the ten networks.

