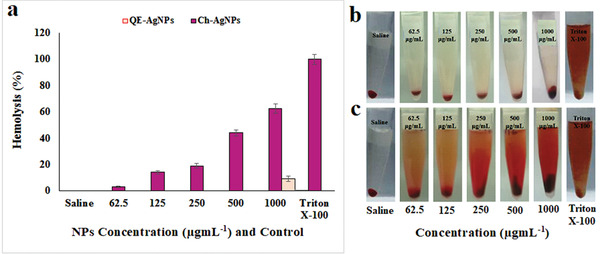
Figure 4.

The hemolytic activity of biogenic Ag‐NPs at various concentrations (62.5–1000 µg mL−1). a) Percentage of hemolysis induced by QE‐Ag‐NPs and Ch‐AgNPs. Photographs of RBCs after exposed to b) QE‐Ag‐NPs and c) Ch‐AgNPs. Triton‐X‐100 and saline were, respectively, used as positive control and negative control.
