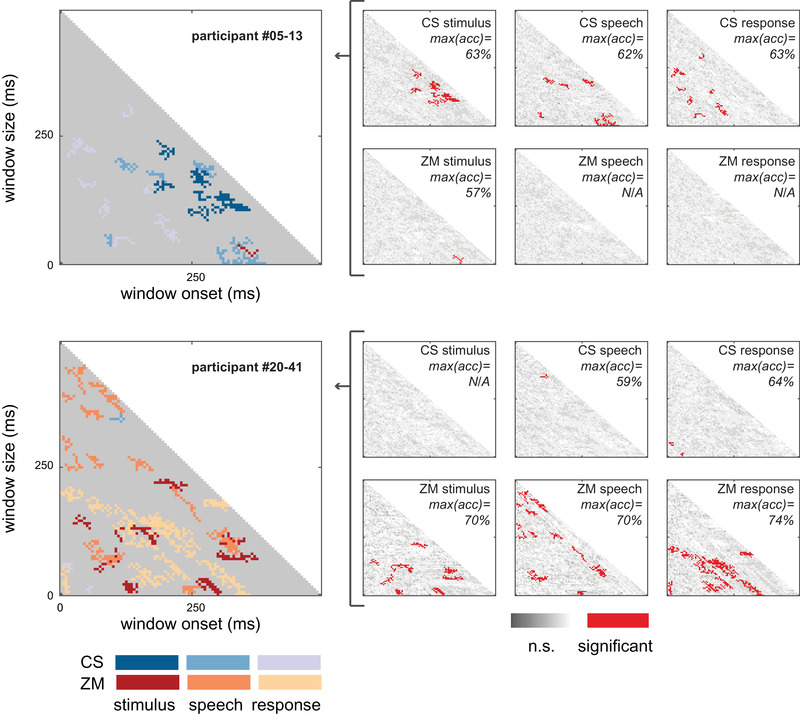
FIGURE 2.

Deception Detection Matrices (DDMs) of participants #05–13 and #20–41. Right panels: Each matrix element was derived from 1 s event‐related epoch from either the ZM or CR facial muscle regions, during stimulus, speech, or response. Red indicates a successful lie detection. Data were calculated for bins varying in duration (y‐axes) and sampled starting at varying time‐points relative to the event onset (x‐axes). Big panels: For each participant, the six DDMs were aggregated into a single matrix. Color coding was used to indicate muscle region and trigger (i.e., stimulus, speech, or response)
