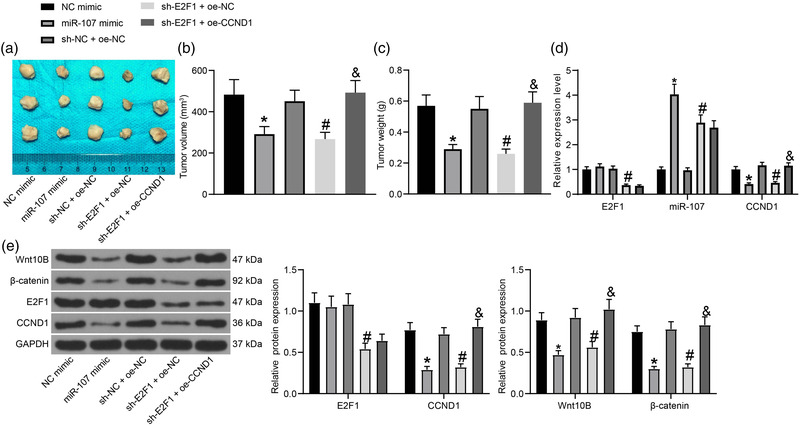
FIGURE 6.

The functions of E2F1, miR‐107 and CCND1 in tumorigenesis of glioma cells in vivo. (a) Images of the tumors in each group; (b) Volume and (c) weight of the xenograft tumors on the 21st day after cell injection; (d) Expression of miR‐107 and E2F1 and CCND1 mRNA in tumor tissues examined by RT‐qPCR; (e) Protein levels of E2F1, CCND1, Wnt10B, and β‐catenin in tumor tissues examined by western blot analysis. Data were collected from three independent experiments and presented as mean ± SD. In each group, n = 5. Differences were compared by one‐way ANOVA (b,c) or two‐way ANOVA (d,e), *p < .05 versus NC mimic; #p < .05 versus sh‐NC + oe‐NC; and p < .05 versus sh‐E2F1 + oe‐NC
