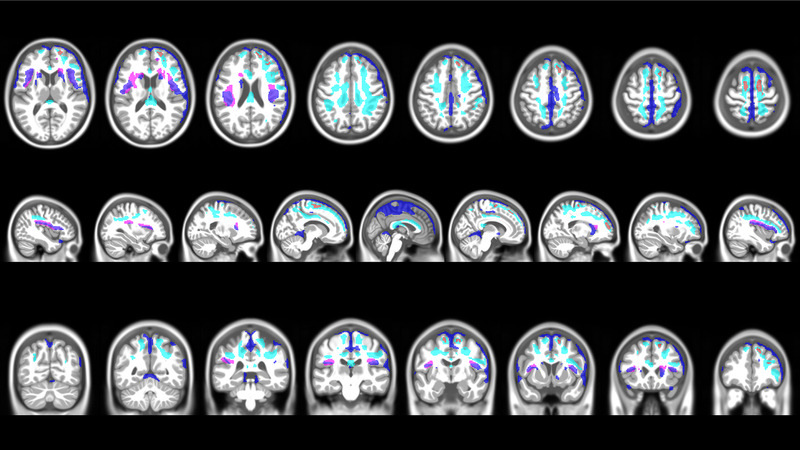
FIGURE 3.

Combined voxel‐wise GM and WM changes in mTBI participants. The mTBI participants GM and WM probability changes from 6 weeks to 1 year are overlayed on the same brain template to illustrate the spatial relationship of the tissue changes. To allow for an easier comparison of the voxel‐wise change pattern, the statistical threshold was lowered to 0.01 FWE corr. (TFCE). Dark blue color indicates brain regions with a significant GM decrease and red color highlights brain regions with a small but significant GM increase (see row 1, the first three axial slices, right superior frontal gyrus). Cyan color indicates brain regions with a WM decrease and violet color highlights brain regions with a WM increase
