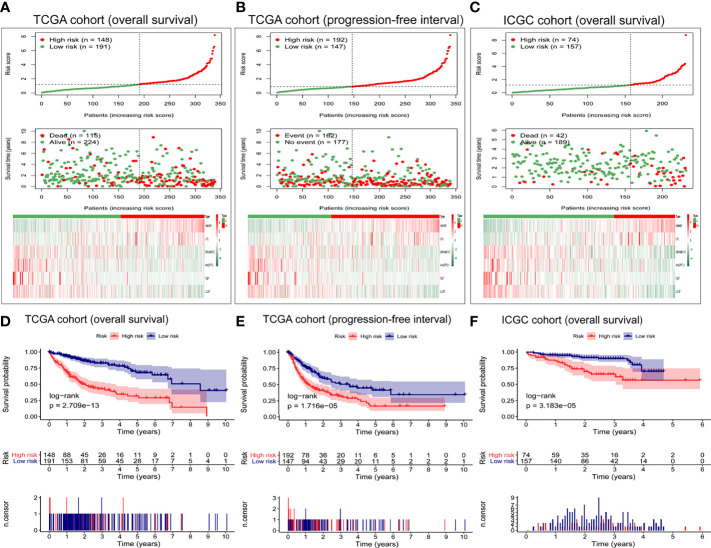
Figure 3.
Evaluation of the prognostic capacity of the six-gene expression signature. Distribution of six-gene risk scores, survival time, survival state, and the six-gene expression heat map between the low- and high-risk groups based on (A) overall survival or (B) progression-free interval in TCGA cohort, or on (C) overall survival in the ICGC cohort. Kaplan-Meier survival analysis based on (D) overall survival and (E) progression-free interval in TCGA cohort. Kaplan-Meier survival analysis based on (F) overall survival in the ICGC cohort. Differences between survival curves were assessed for significance using the log-rank test.

