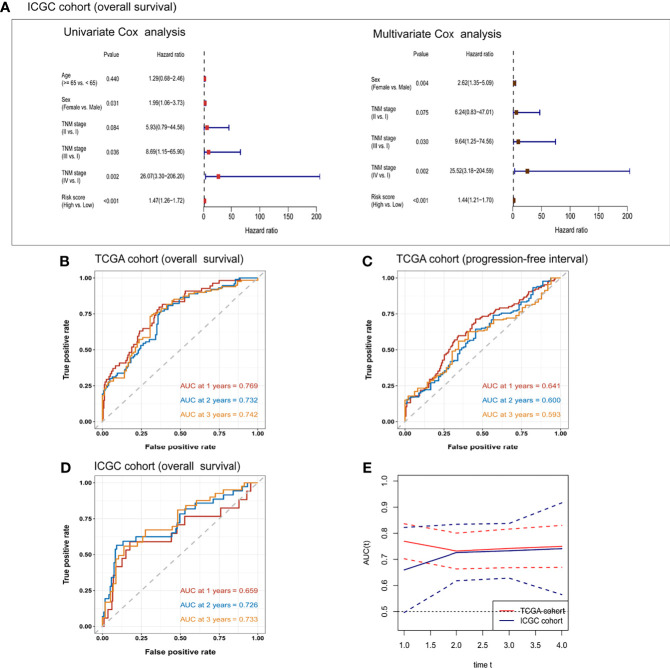
Figure 4.
Univariate and multivariate Cox regression analyses of the risk score and clinical/demographic indicators related to (A) overall survival in the ICGC cohort. Receiver operating characteristic curves for the prediction of one-, two-, and three-year (B) overall survival or (C) progression-free interval in TCGA cohort, or (D) overall survival in the ICGC cohort. (E) Time-dependent area under the receiver operating curve (AUC) and the corresponding 95% confidence intervals for predicting overall survival at one, two, and three years. The red line corresponds to TCGA cohort and the blue line corresponds to the ICGC cohort.

