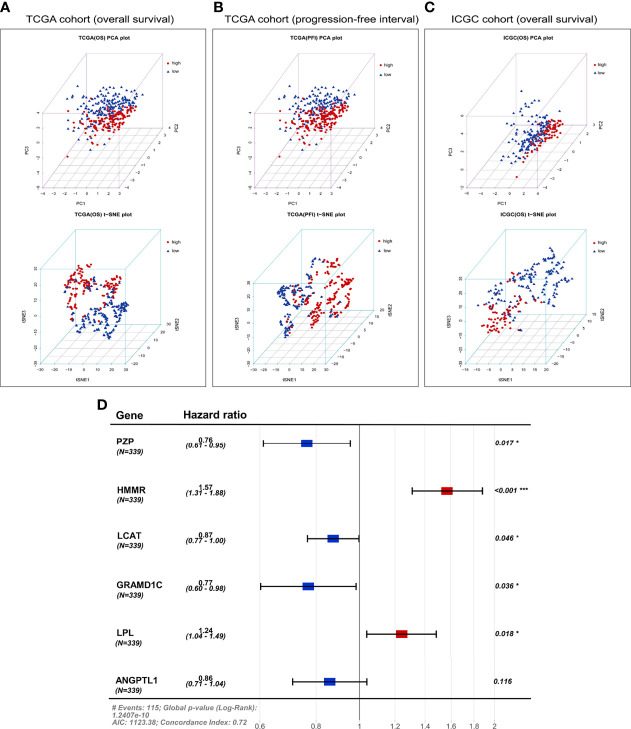
Figure 6.
Principal component analysis (PCA) and t-distributed stochastic neighbor embedding (t-SNE) analysis based on the six-gene expression signature. PCA and t-SNE plot of (A) overall survival or (B) progression-free interval in TCGA cohort, or (C) overall survival in the ICGC cohort. (D) Forest plot of the six genes in the prognostic risk model and overall survival in TCGA cohort. AIC, Akaike Information Criterion.

