Figure 7.
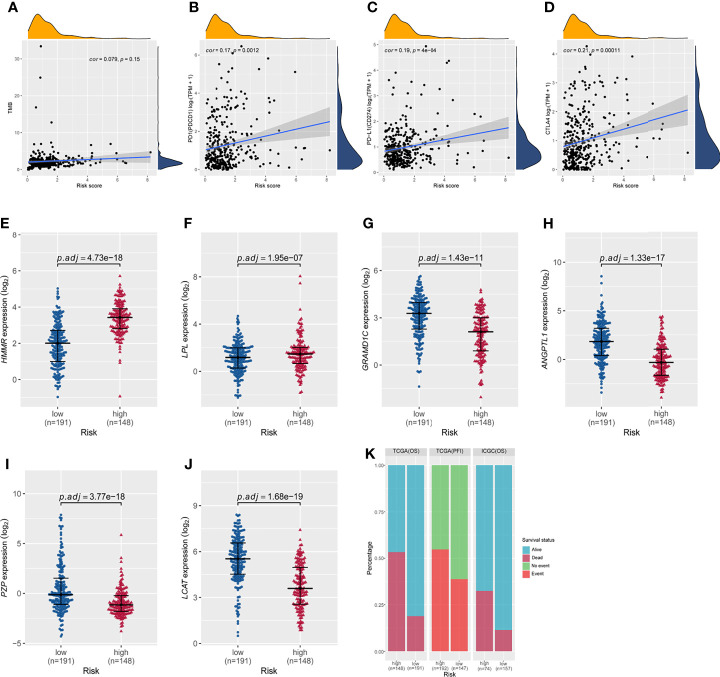
Correlations of the risk score based on the six-gene prognostic model with tumor mutational burden; expression of PD1, PD-L1, and CTLA4; and the differential expression of the six signature genes between the high- and low-risk groups in TCGA cohort based on overall survival. (A) The risk score did not correlate with tumor mutational burden. The risk score did not correlate with (B) PD-1 expression, (C) PD-L1 expression, or (D) CTLA-4 expression. (E–J) Expression of HMMR, LPL, GRAMD1C, ANGPTL1, PZP, and LCAT in the high- and low-risk groups of TCGA cohort based on overall survival. P values were adjusted using the Benjamini-Hochberg method. (K) Distribution of patient survival status between the high- and low-risk groups.

