
Figure 1.
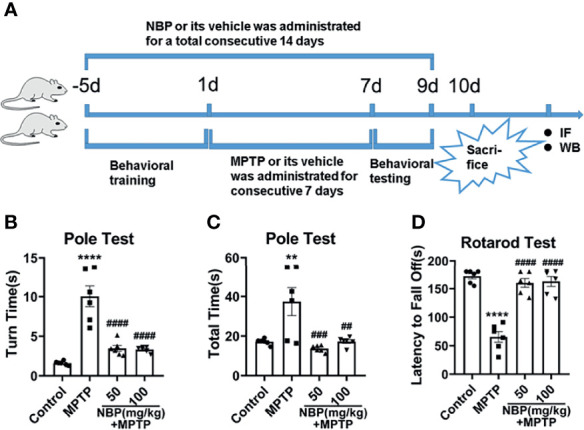
Diagram of the experimental design and behavioral tests in MPTP-induced mice. (A) Experimental design and drug administration scheme to explore the role and mechanism of NBP in MPTP-induced PD mouse model. Total time (B) and turn time (C) spent in the pole test. (D) Latency to fall in the rotarod test. All data are presented as mean ± SEM (n = 6). **p < 0.01, ****p < 0.0001, compared with the Control group; ##p < 0.01, ###p < 0.001, ####p < 0.0001, compared with the MPTP group.