
FIGURE 2.
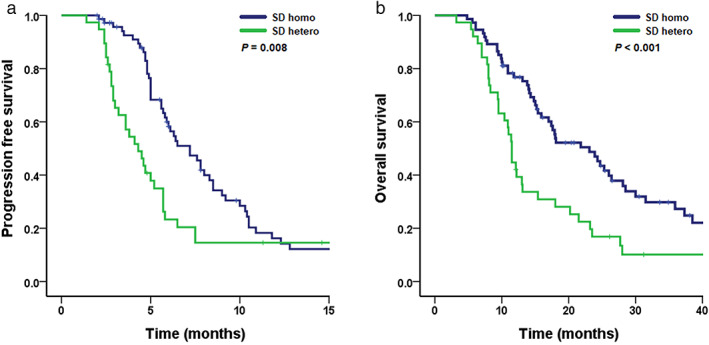
Kaplan–Meier curve of (a) progression‐free survival and (b) overall survival by radiological heterogeneity in the stable disease group
Official websites use .gov
A
.gov website belongs to an official
government organization in the United States.
Secure .gov websites use HTTPS
A lock (
) or https:// means you've safely
connected to the .gov website. Share sensitive
information only on official, secure websites.
Kaplan–Meier curve of (a) progression‐free survival and (b) overall survival by radiological heterogeneity in the stable disease group