Figure 3.
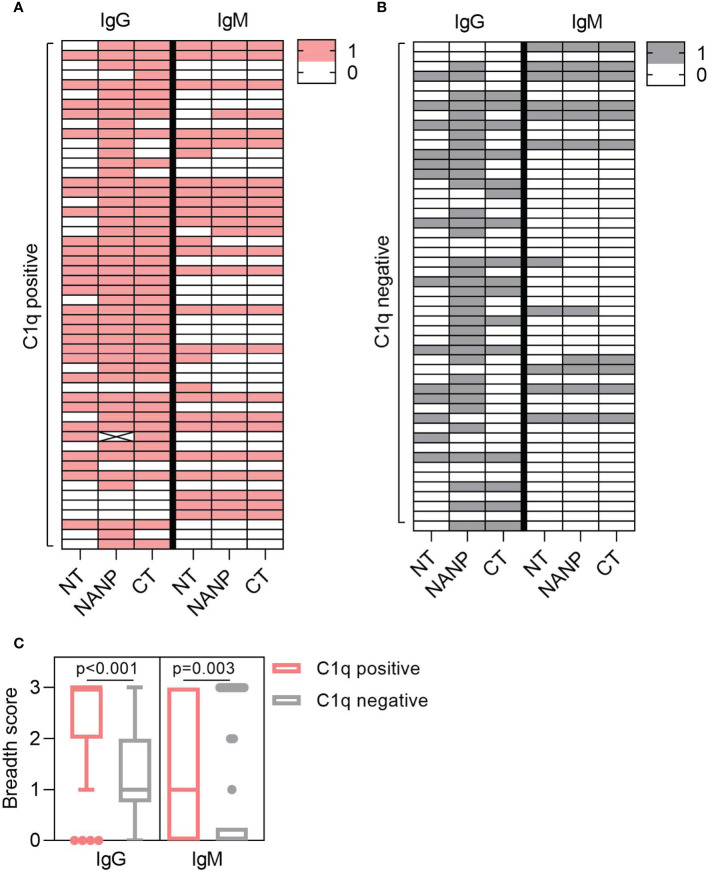
Antibody breadth is associated with C1q-fixation. Plasma collected from malaria exposed adults (n=102) were tested for C1q-fixation to CSP and stratified into (A) C1q positive (n=52) and (B) C1q negative (n=50) groups. Heat-maps display IgG/IgM seropositivity to antigens representing the N-terminal (NT), central-repeat (NANP) and C-terminal (CT) regions of CSP. Each row represents an individual participant that was defined as seropositive (score = 1) or seronegative (score = 0) for IgG or IgM to each antigen. (C) The breadth scores for IgG and IgM were calculated by combining the seropositivity score for all three antigens (total breadth scores were between 0 and 3). The IgG and IgM breadth score for the C1q positive and C1q negative groups are shown as box plots (box represents the 25th and 75th percentile, whiskers represent the highest and lowest values within 1.5xIQR and values outside this range are shown as dots) and were compared using the Mann-Whitney U test.

