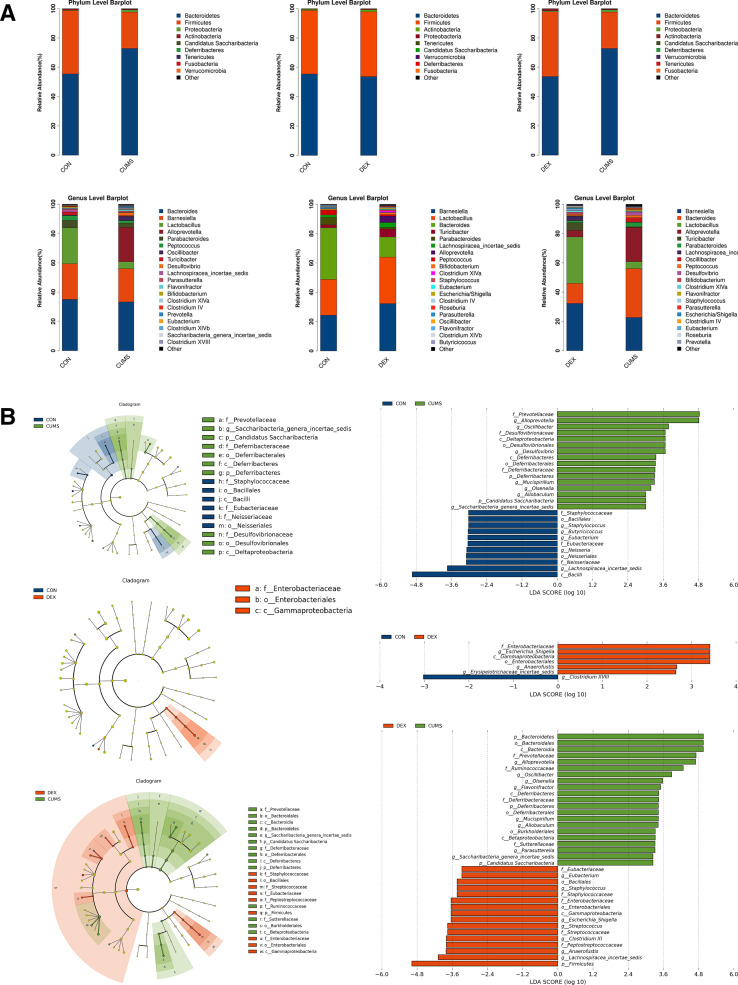
Figure 3.
Differential composition of gut microbiota in two depression models. (A) Comparison of the abundance of microbial phylum and genus in CON, CUMS and DEX groups. LDA score plot and cladogram plot from LEfSE analysis of the gut microbiota composition in CON, CUMS and DEX groups at baseline and end point. (B) Microbial taxa shown have an LDA score higher than 2. CON, control; CUMS, chronic unexpected mild stress; DEX, dexamethasone; LDA, linear discriminant analysis; LEfSE, linear discriminant analysis effect size.

