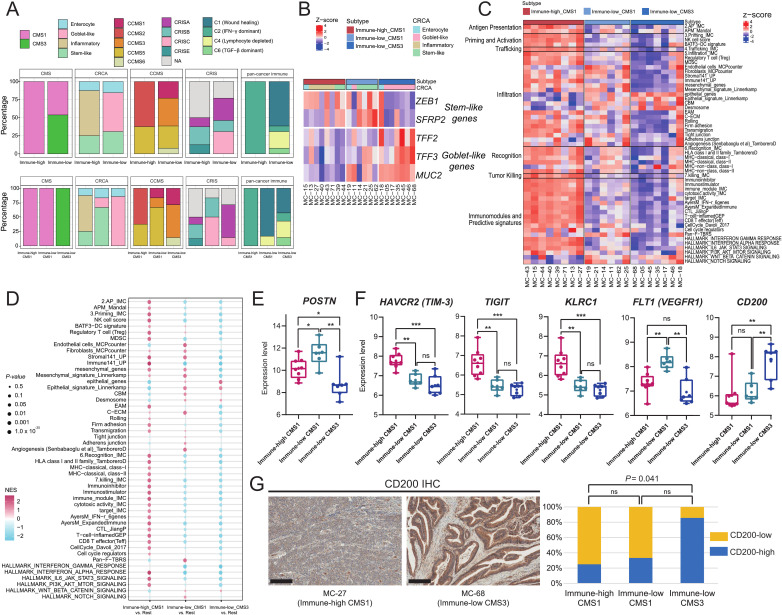
Figure 4.
Combined immune CMS subtyping of MSI-H CRCs and its immuno-oncological implications. (A) Molecular subclassification of the immune subgroups of MSI-H CRCs using various molecular subtyping systems. Each column cluster is the representative CRC molecular classification, including the CMS, CRCA, CCMS, CRIS, or pan-cancer immune subtype classification. The upper row represents the distribution pattern of each classification in the immune-high and immune-low subgroups. The lower row represents distribution pattern of each classification in the immune-high CMS1, immune-low CMS1, and immune-low CMS3 subtypes. (B) An expression heatmap of stem-like and goblet-like genes according to the immune CMS subtypes. Each column cluster represents the immune-high CMS1, immune-low CMS1, and immune-low CMS3 subtypes. Each row represents the gene expression pattern of stem-like and goblet-like genes. (C) A heatmap of immune cycle and immune response predictive signature scores using single-sample gene-set enrichment analysis, according to the immune CMS subtypes. Each column cluster represents the immune-high CMS1, immune-low CMS1, and immune-low CMS3 subtypes. Each row represents the expression pattern of a curated gene-set, clustered into six immune cycles and one predictive signature. (D) GSEA results of immune cycle and immune response predictive signatures according to the immune CMS subtypes. Each column cluster represents the immune-high CMS1, immune-low CMS1, and immune-low CMS3 subtypes. Each row represents the expression pattern of the curated gene-set. Each GSEA was performed between one subtype vs two other subtypes. (E) Comparison of POSTN expression between the three immune CMS subtypes. (**, 0.001≤p < 0.01; *, 0.01≤p < 0.05; Mann-Whitney U test) (F) Comparison of DEG expression between the three immune CMS subtypes. DEGs were selected from the immuno-oncological target list. (***, p<0.001; **, 0.001≤p < 0.01; *, 0.01≤p < 0.05; ns, not significant; Mann-Whitney U test). (G) Representative photomicrographs of CD200 IHC of immune-high CMS1 and immune-low CMS3 tumors (left; scale bar, 200 µm). Comparison of proportions of the CD200-high subgroup between the three immune subtypes (right). CD200-high or CD200-low subgroups were classified using a cut-off value of an average of CD200 IHC H-scores. CCMS, colon cancer molecular subtype; CMS, consensus molecular subtype; CRC, colorectal cancers; CRCA, colorectal cancer assigner; CRIS, colorectal cancer intrinsic subtype; DEG, differentially expressed genes; IFN, interferon; IHC, immunohistochemistry; MSI-H, microsatellite instability-high; GSEA, gene-set enrichment analysis; TGF, transforming growth factor.

