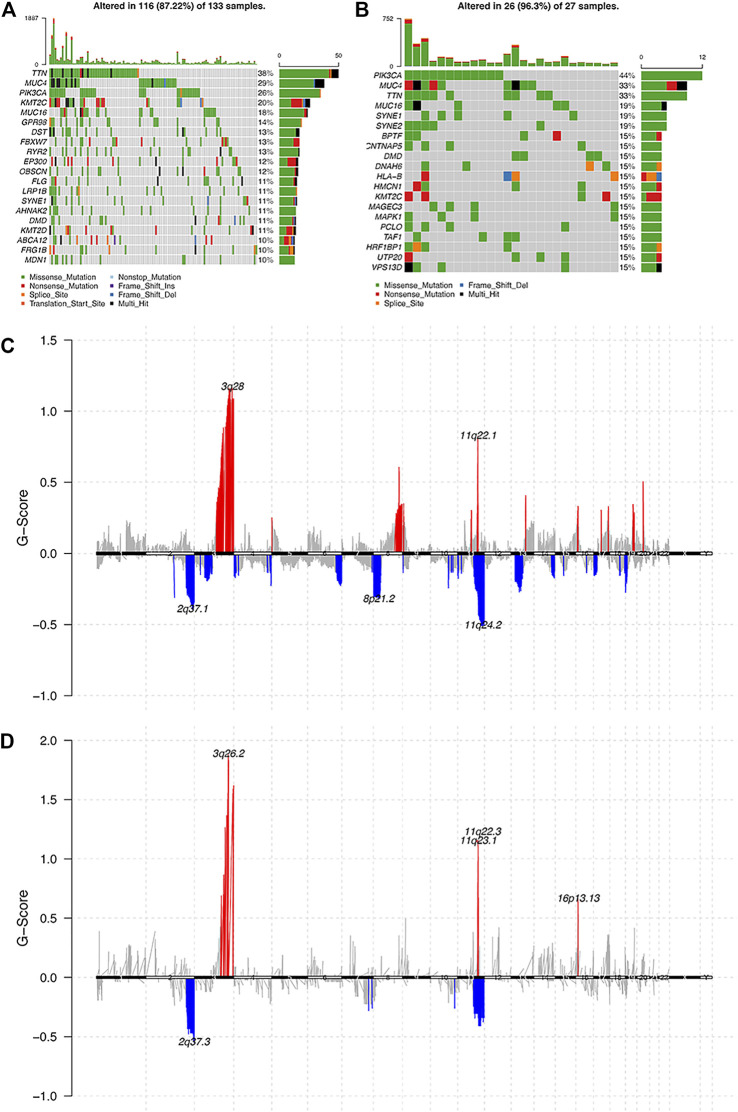
FIGURE 3.
Analysis of the molecular characters between pure HPV-infection and HPV-int samples. (A): Gene mutation in pure HPV-infection samples, (B): Gene mutation in HPV-int samples, (C): Distribution of CNV regions among pure HPV-infection samples, (D): Distribution of CNV regions among HPV-int samples.

