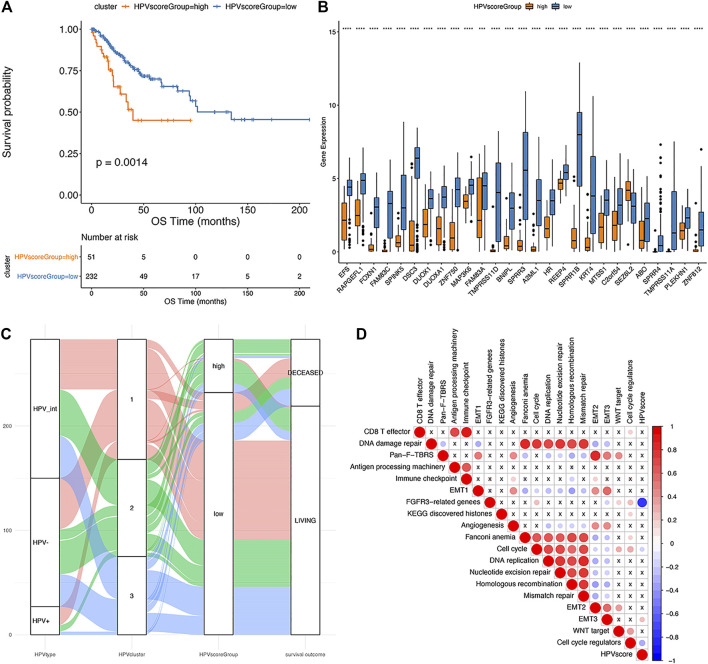
FIGURE 7.
The establishment of HPV score system. (A): Kaplan-Meier analysis of overall survival in cervical cancer patients stratified by HPV score; (B): The expression of HPV score associated genes in different HPV score groups (significance analysis by t-test); (C): The alluvial plot showing the correlation among HPV status, iCluster clustering and HPV score; (D): Pearson analysis of HPV score and its associated genes (The negative correlation is marked in blue and positively correlated with red. The X in the graph indicates that the correlation is not significant, and the larger the circle is, the more significant the correlation is).

