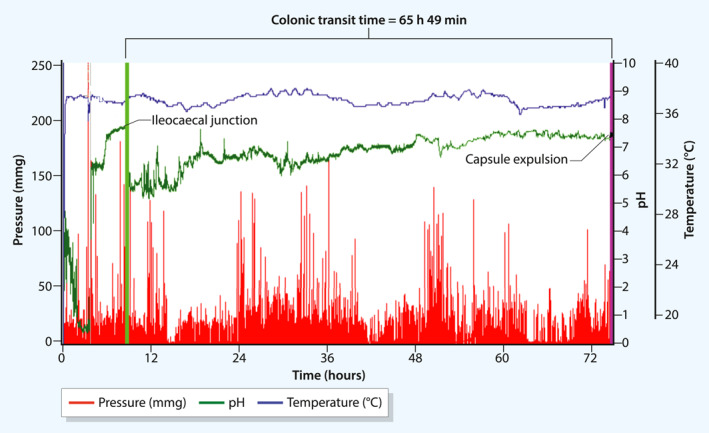
FIGURE 1.

Illustration of a wireless motility capsule recording in a diabetes patient with constipation. The recording shows temperature (°C, top blue curve), pH (middle green curve) and pressure (mmHg, bottom red curve). Colonic transit time is measured from the ileocaecal junction to capsule expulsion, as marked by arrows. In this patient, colonic transit was 65 h 49 min (normal: <5:00–50:30, h:min), indicating slow‐transit constipation
