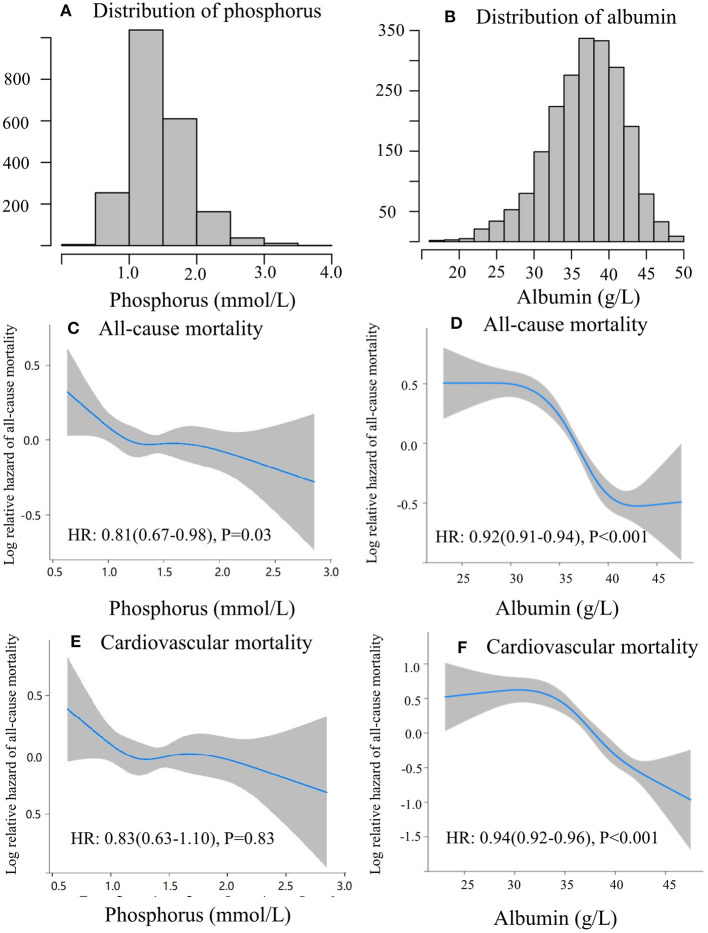
Figure 2.
Linear and non-linear correlation between serum phosphorus and albumin with mortality. The distribution of serum phosphorus (A), and albumin (B). Restricted cubic spline of phosphorus (C), albumin (D) and all-cause mortality; restricted cubic spline of phosphorus (E), albumin (F), and cardiovascular mortality.

