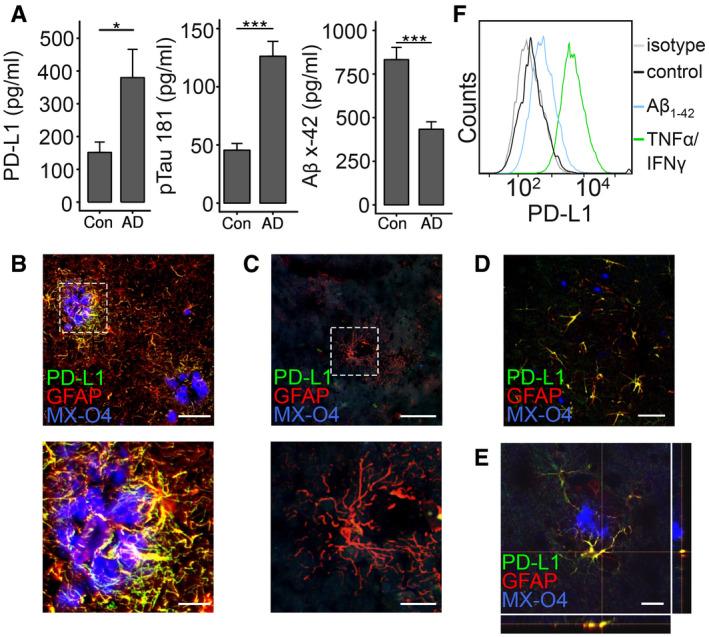
Figure 1. Expression of PD‐L1 in AD and in APP/PS1 transgenic mice.

-
AELISA quantification of PD‐L1, pTau 181, and Aβx‐42 in the CSF of control and AD patients (n = 10 ± SEM, Student's t‐test, *P < 0.05 and ***P < 0.001, PD‐L1: t = 2.47 df = 18, Aβx‐42: t = 4.83 df = 18, pTau 181: t = 5,768 df = 18).
-
B, C(B) Colocalization of PD‐L1 and GFAP in AD and (C) in control patients (MX‐O4 = amyloid deposits, upper picture: bar = 100 µm, lower picture: bar = 30 µm).
-
DImmunohistochemical detection of PD‐L1 and GFAP in 9‐month‐old female APP/PS1 mice (bar = 50 µm).
-
EImmunohistochemical detection of PD‐L1 and GFAP in 4‐month‐old female APP/PS1 mice (bar = 20 µm).
-
FInduction of PD‐L1 on astrocytes using 1 μM aggregated Aβ1‐42 or 10 μg/ml TNF‐α/100 U/μl IFN‐γ analyzed by flow cytometry.
