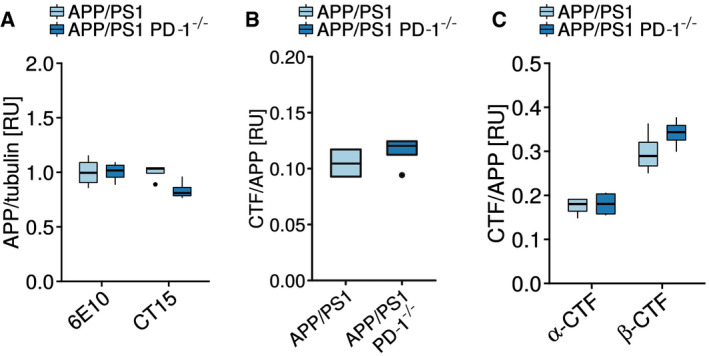
Figure EV1. APP expression is unaltered in APP/PS1 PD‐1−/− mice.

- Quantification of the APP expression normalized to tubulin shown in Fig 4F (biological replicates with n = 4 mice per group, one‐way ANOVA (df = 1, F = 2.776, P = 0.122), Tukey’s post hoc test).
- Quantification of the 6E10 Western blot and the calculation of the APP C‐terminal fragment (CTF)‐to‐APP ratio shown in Fig 4F (biological replicates with n = 4 mice per group, Student's t‐test (t = 0.9435, df = 6), P = 0.3818).
- Quantification of the CT15 Western blot and the calculation of the APP α‐C‐terminal fragment (α‐CTF)‐to‐APP and the APP β‐C‐terminal fragment (β‐CTF)‐to‐APP ratio shown in Fig 4F (biological replicates with n = 4 mice per group, ANOVA (df = 1, F = 1.184, P = 0.298), Tukey HSD).
Data information: (A–C) Central bands represent median, boxes show interquartile range (IQR), and whiskers define the ± 1.5xIQR.
