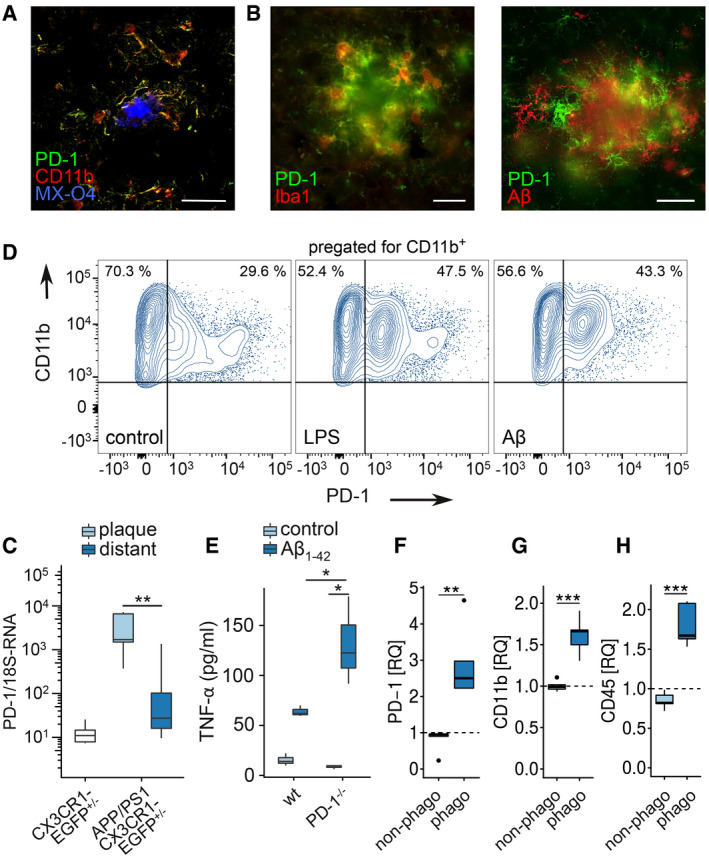
Figure 3. PD‐1 expression in APP/PS1 and AD.

-
AColocalization of PD‐1 and CD11b (MX‐04 = methoxy‐XO4, stains amyloid deposits) in AD by immunohistochemistry (bar = 50 µm).
-
BColocalization of PD‐1 and Iba1 or PD‐1 and Aβ in a female APP/PS1 mouse at 9 months of age by immunohistochemistry (bar = 20 µm).
-
CPD‐1 mRNA quantification in laser‐dissected microglia from CX3CR1‐EGFP+/− mice (wt) or plaque‐associated (plaque) and plaque‐distant (distant) microglia from APP/PS1 CX3CR1‐EGFP+/− mice (n = 6, Mann–Whitney test, **P = 0.0043, W = 35).
-
DInduction of PD‐1 on CD11b+ microglia in vitro using 1 μM Aβ or 100 ng/ml LPS, analyzed by flow cytometry.
-
EELISA analysis of TNF‐α secretion by wild‐type (wt) and PD‐1−/− microglia induced by 0.5 µM Aβ1‐42 for 6 h in vitro (n = 3 biological replicates, one‐way ANOVA (df = 1, F = 8.29, P = 0.021), Tukey's HSD, *P < 0.05).
-
F–HMicroglia from methoxy‐XO4‐injected, 8‐month‐old female, wild‐type (wt), and APP/PS1 mice were analyzed (F) for PD‐1 (n = 5 biological replicates per group, one‐way ANOVA (df = 2, F = 13.99, P = 0.0013), Tukey's HSD, **P < 0.01), (G) for CD11b (n = 5 biological replicates per group, one‐way ANOVA (df = 2, F = 30.06, P = 5.47 × 10⁻⁵), Tukey's HSD, ***P < 0.001), and (H) for CD45 by flow cytometry (n = 5 biological replicates per group, one‐way ANOVA (df = 1, F = 24.96, P = 0.00013), Tukey's HSD, ***P < 0.001) and normalized to the expression of wild‐type mice (represented by dashed lines).
Data information: (C, E–H) Central bands represent median, boxes show interquartile range (IQR), and whiskers define the ± 1.5xIQR.
