-
A, B
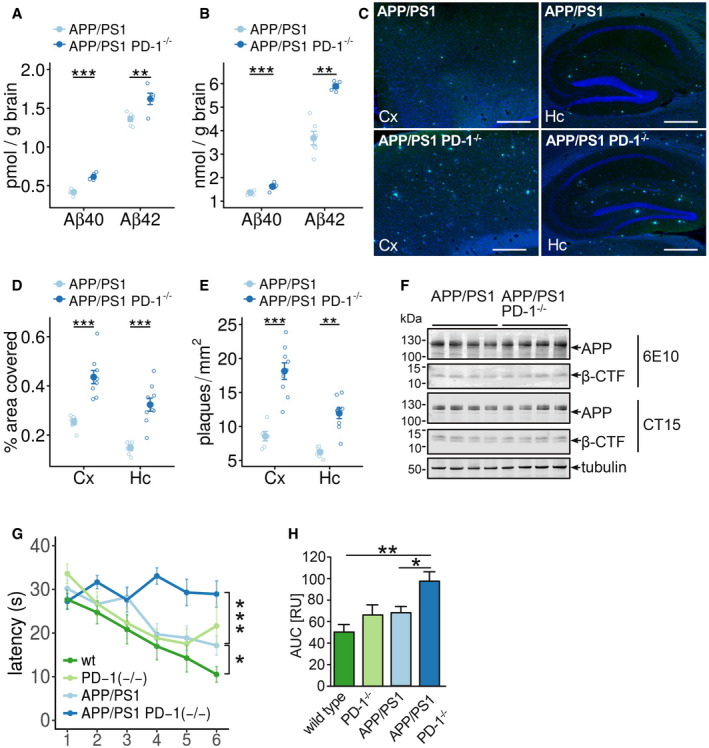
ELISA of the (A) RIPA‐soluble fraction of female APP/PS1 and APP/PS1 PD‐1−/− mice for Aβx‐40 (biological replicates with n = 6 for APP/PS1 and n = 5 for APP/PS1 PD‐1−/−, mean ± SEM, one‐way ANOVA (df = 1, F = 0.6, P = 0.45), Tukey's HSD, **P < 0.01, ***P < 0.001) and (B) of the SDS‐soluble fraction (biological replicates with n = 6 for APP/PS1 and n = 5 for APP/PS1 PD‐1−/−, mean ± SEM, one‐way ANOVA (df = 1, F = 32.8, P = 2 × 10⁻⁵), Tukey's HSD, **P < 0.01, ***P < 0.001).
-
C
Thioflavin T histochemistry from sagittal brain sections in the hippocampus (Hc), and cortex (Cx) of female APP/PS1 and APP/PS1 PD‐1−/− mice. Nuclei were stained using Hoechst 33342 (bar = 500 μm).
-
D, E
Mice were analyzed for (D) percentage of the covered areas (5 sections per mouse analyzed with the mean representing an individual data point; biological replicates with n = 6 for APP/PS1 and n = 9 for APP/PS1 PD‐1−/−, mean ± SEM, one‐way ANOVA (df = 1, F = 0.905, P = 0.90), Tukey's HSD, ***P < 0.001) and (E) the number of plaques per mm2 (5 sections per mouse analyzed with the mean representing an individual data point; biological replicates with n = 6 for APP/PS1 and n = 9 for APP/PS1 PD‐1−/−, mean ± SEM, one‐way ANOVA (df = 1, F = 4.08, P = 0.054), Tukey's HSD, **P < 0.01, ***P < 0.001).
-
F
Western blot analysis of brain lysates from female APP/PS1 and APP/PS1 PD‐1−/− mice for the expression of APP and APP C‐terminal fragments using antibodies 6E10 (transgene expression) and CT15 (transgene and endogenous expression). Tubulin was used as a loading control.
-
G
Time needed to reach the hidden platform (latency in seconds) in the Morris water maze test (mean ± SEM of biological replicates with n = 12 for wt, n = 5 for PD‐1−/−, n = 7 for APP/PS1, and n = 8 for APP/PS1 PD‐1−/−, one‐way ANOVA (df = 3, F = 17.72, P = 1 × 10⁻⁹), Tukey's HSD, *P < 0.05, ***P < 0.001).
-
H
Analysis of the area under the curve (mean + SEM of biological replicates with n = 12 for wt, n = 5 for PD‐1−/−, n = 12 for APP/PS1, and n = 8 for APP/PS1 PD‐1−/−, ANOVA (df = 3, F = 6.98, P = 0.001), *P < 0.05 and **P < 0.01).

