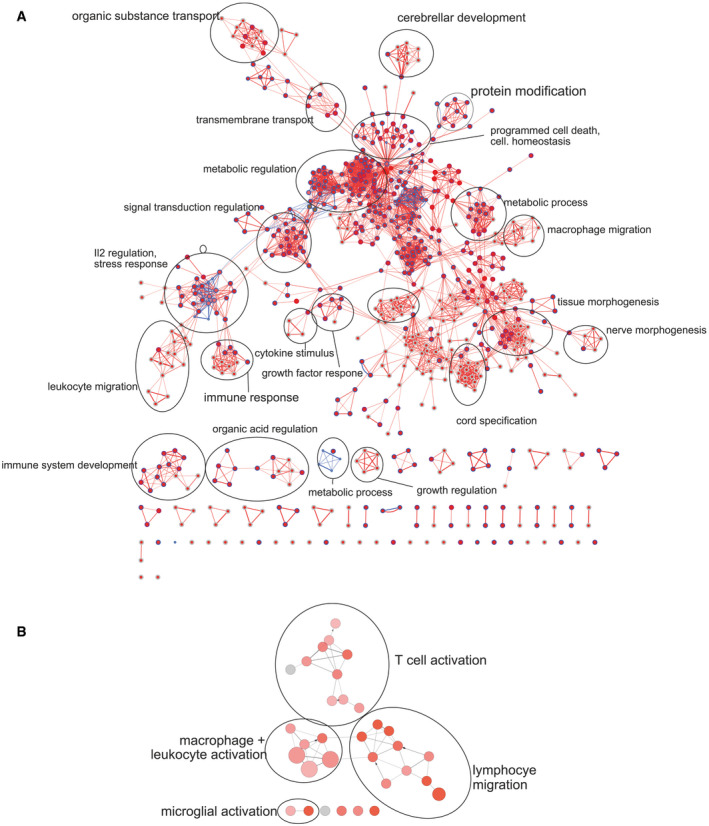
Figure EV5. Gene ontology (GO) enrichment analysis.

- Visualization of gene ontology enrichment analysis (GOEA) of DE genes (PD‐1−/− vs. wild‐type microglia: blue = downregulated genes, red = upregulated genes) using BiNGO and the EnrichmentMap plugin.
- ClueGO network analysis of “Immune System Process” GO terms of DE genes (PD‐1−/− vs. wild‐type microglia: red = upregulated genes).
