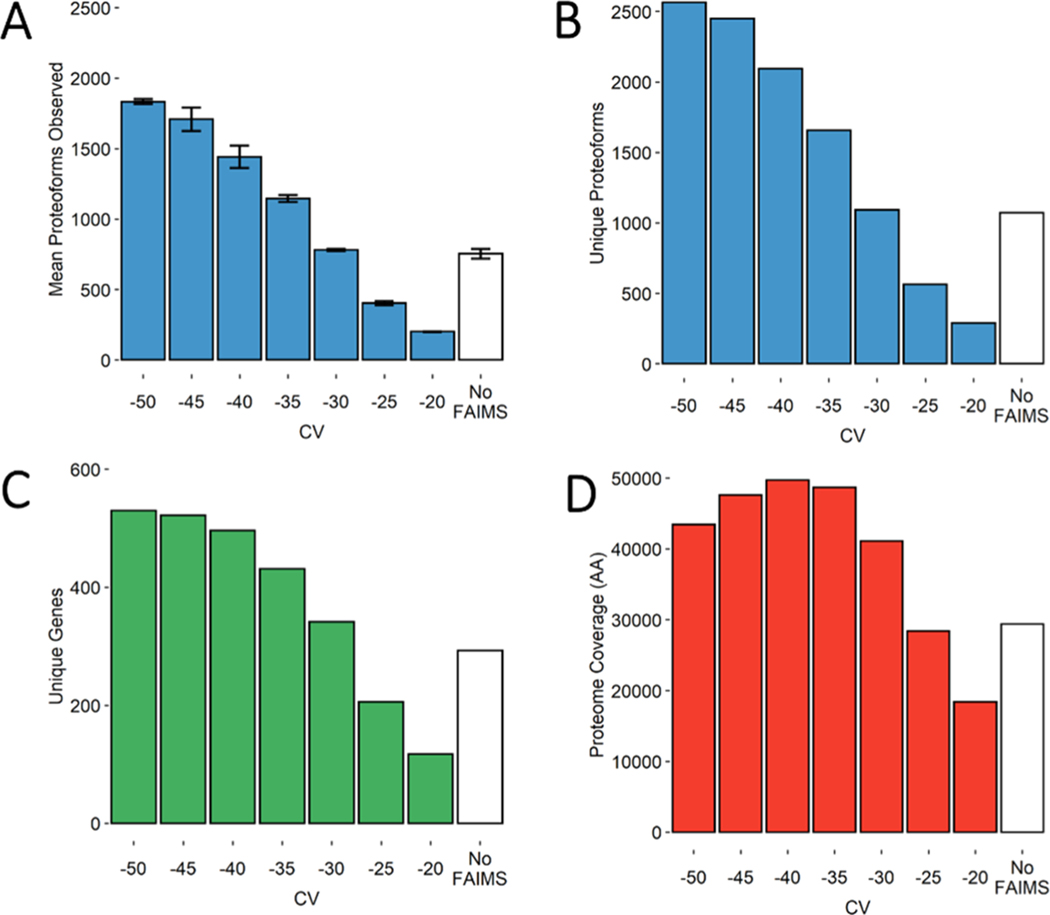
Figure 2.
Bar charts demonstrating several metrics used in the comparison of FAIMS CVs in steps of 5 V with “No FAIMS” data sets. (A) Mean number of proteoform identifications per replicate (n = 3). Error bars represent standard deviation from the mean. (B) Total unique proteoforms found across all three replicates for each FAIMS CV or “No FAIMS”. (C) Total unique genes found across all three replicates for each FAIMS CV or “No FAIMS”. (D) Total proteome coverage or non-redundant amino acids covered by each proteoform’s sequence, found across all three replicates for each FAIMS CV or “No FAIMS”.

