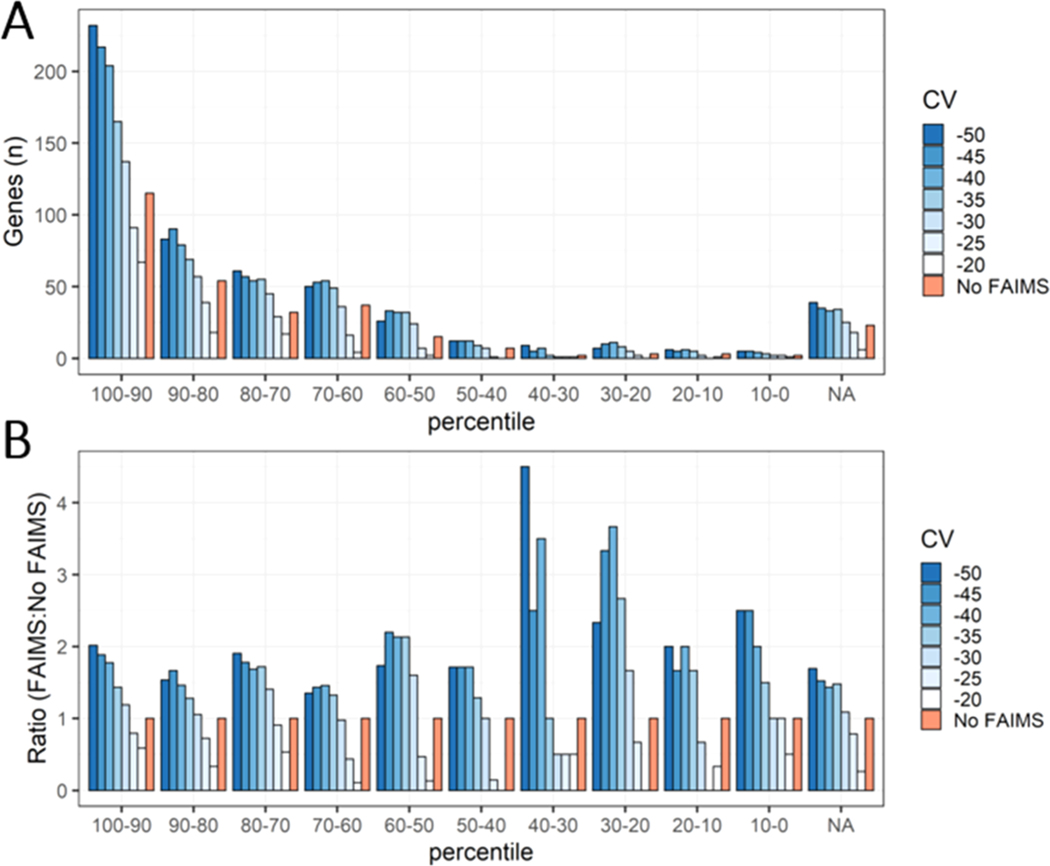
Figure 6.
Bottom-up data sets from human brain tissue were used to estimate protein abundance by weighted spectral counting. These proteins were then binned into 10 different abundance percentiles, as well as a top-down only bin indicated as “NA”. (A) Comparison between the genes found in FAIMS and “No FAIMS” data sets across the 10 different abundance percentiles, as well as genes only found from our top-down analysis. (B) The number of genes for each FAIMS CV was normalized to the number of genes found in the “No FAIMS” data sets for each abundance percentile bin.

