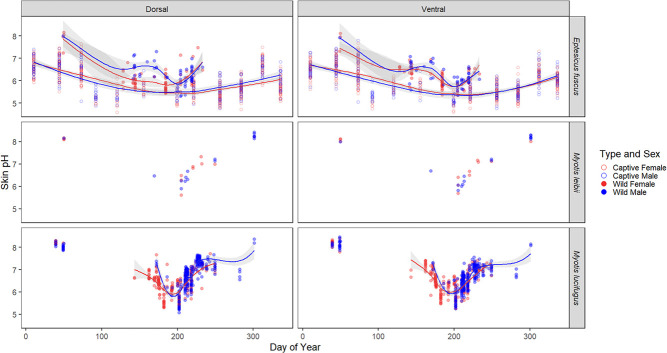
Figure 4.
Plagiopatagium flight membrane pH of E. fuscus (captive and wild) and wild M. leibii and M. lucifugus over time (data from all provinces). Sample sizes are listed in Supplementary Table S2. Lines indicating the mean pH (95% confidence intervals in grey shading) were predicted using the loess method. Seasonal patterns in M. septentrionalis and P. subflavus could not be assessed due to low sample sizes.

