
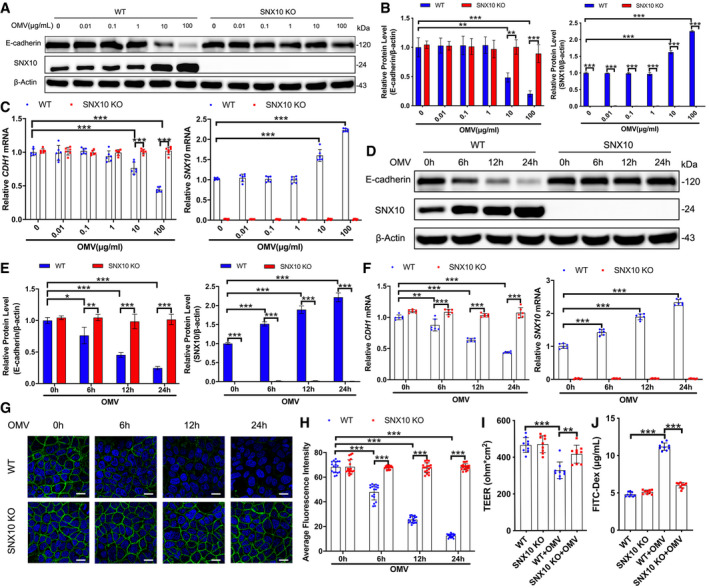
Figure 1. SNX10 involves in OMV‐induced downregulation of E‐cadherin in intestinal epithelial cells.
-
A–CWT and SNX10 KO Caco‐2 cells were treated with indicated doses of OMVs for 24 h. Protein expression of E‐cadherin and SNX10 was determined by immunoblots (A) and quantified by ImageJ software (B) (n = 3 independent experiments). The fold changes in mRNA levels of CDH1 (encoding E‐cadherin) and SNX10 in Caco‐2 cells were determined by RT–qPCR (C) (n = 6 independent experiments).
-
D–FWT and SNX10 KO Caco‐2 cells were treated with OMVs (100 μg/ml) for the indicated time. Protein expression of E‐cadherin and SNX10 was determined by immunoblots (D) and quantified by ImageJ software (E) (n = 3 independent experiments). The fold changes in mRNA levels of CDH1 and SNX10 were determined by RT–qPCR (F) (n = 6 independent experiments).
-
G, HConfocal images of E‐cadherin staining in Caco‐2 cells treated with OMVs (100 μg/ml) for the indicated time were captured (G), and the fluorescence intensity of E‐cadherin staining was quantified by ImageJ software (H) (n = 3 independent experiments, n = 18 fields analyzed). Scale bar: 20 μm.
-
ITEER value of Caco‐2 cell monolayers incubated with or without OMVs (100 μg/ml) for 24 h was analyzed (n = 9 independent experiments).
-
JCaco‐2 cell monolayers on transwell membranes were treated with or without OMVs (100 μg/ml) for 24 h. FITC‐dextran was added to these cells (top of the membrane). After 2 h, FITC‐dextran levels in the bottom chamber wells were measured (n = 9 independent experiments).
Data information: Data are means ± SD. One‐way ANOVA followed by Bonferroni post hoc test was used for statistical analyses. *P < 0.05; **P < 0.01; ***P < 0.001.
Source data are available online for this figure.