
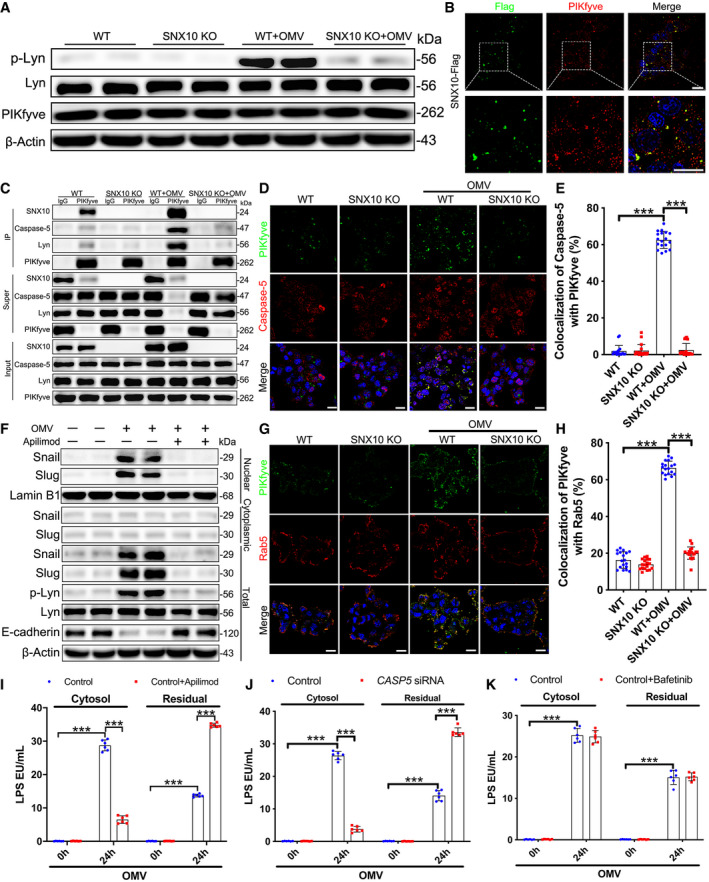
Figure 6. Recruitment of caspase‐5 to PIKfyve by SNX10 triggers LPS release from early endosomes into the cytosol.
-
ALysates from WT and SNX10 KO Caco‐2 cells treated with or without 100 μg/ml OMVs for 24 h were analyzed by immunoblots with the indicated antibodies.
-
BCo‐staining of SNX10‐Flag and PIKfyve in Caco‐2 cells transfected with SNX10‐Flag. Scale bar: 20 μm.
-
CWT and SNX10 KO Caco‐2 cells were treated with or without OMVs (100 μg/ml) for 24 h and then subjected to IP with anti‐PIKfyve antibody.
-
D, ECo‐staining of PIKfyve and caspase‐5 in WT and SNX10 KO Caco‐2 cells treated with or without OMVs (100 μg/ml) for 24 h (D). Anti‐PIKfyve and anti‐caspase‐5 antibodies were used to detect endogenous PIKfyve and caspase‐5, respectively. Scale bar: 20 μm. Co‐localized PIKfyve and caspase‐5 were quantified by ImageJ software (E) (n = 3 independent experiments, n = 18 fields analyzed).
-
FCaco‐2 cells were stimulated by OMVs (100 μg/ml) with or without apilimod (30 nM) for 24 h. Proteins of lysates extracted from Caco‐2 cells were subjected to immunoblots with the indicated antibodies.
-
G, HCo‐staining of PIKfyve and Rab5 in WT and SNX10 KO Caco‐2 cells treated with or without OMVs (100 μg/ml) for 24 h (G). Anti‐PIKfyve and anti‐Rab5 antibodies were used to detect endogenous PIKfyve and Rab5, respectively. Scale bar: 20 μm. Co‐localized PIKfyve and caspase‐5 were quantified by ImageJ software (H) (n = 3 independent experiments, n = 18 fields analyzed).
-
ILPS levels in the cytosolic and residual fractions of Caco‐2 cells stimulated by OMVs (100 μg/ml) with or without apilimod (30 nM) for the indicated time were detected by LAL assay (n = 6 independent experiments).
-
JCaco‐2 cells transfected with control siRNA or CASP5 siRNA were treated with OMVs (100 μg/ml) for the indicated time. LPS levels in the cytosolic and residual fractions of Caco‐2 cells were detected by LAL assay (n = 6 independent experiments).
-
KLPS levels in the cytosolic and residual fractions of Caco‐2 cells stimulated by OMVs (100 μg/ml) with or without bafetinib (1 μM) for the indicated time were detected by LAL assay (n = 6 independent experiments).
Data information: Data are means ± SD. One‐way ANOVA followed by Bonferroni post hoc test was used for statistical analyses. ***P < 0.001.
Source data are available online for this figure.