
Figure 7. SNX10 deficiency protects against IL‐10 deficiency‐induced chronic colitis and maintains the intestinal barrier function in mice.
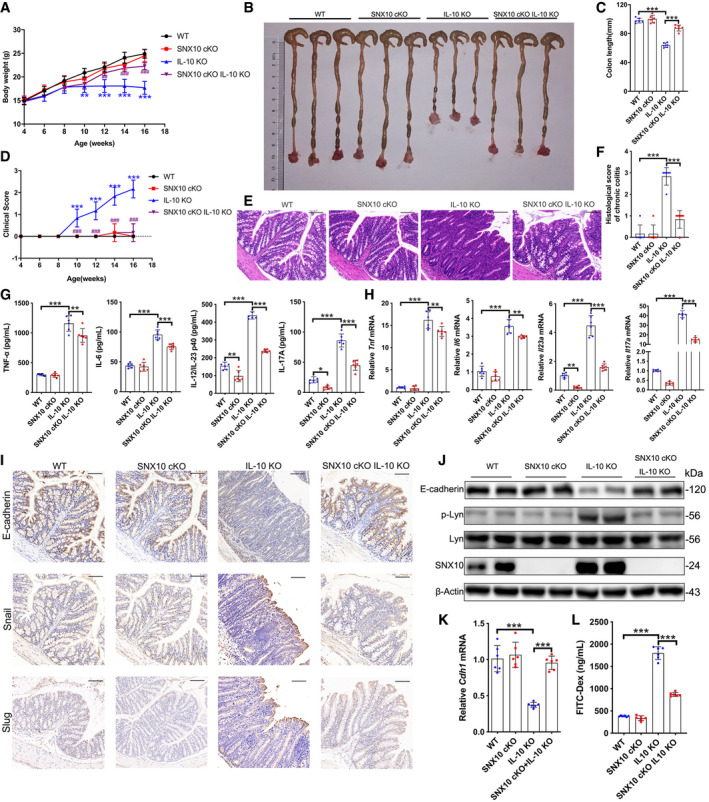
SNX10 conditional knockout (SNX10 cKO) mice with or without IL‐10 KO background and littermate wild‐type (WT) mice with or without IL‐10 KO background were compared (n = 6 animals, each group).
-
ABody weight of mice was measured every 2 weeks from the 4th week to 16th week. Data are means ± SD. One‐way ANOVA followed by Bonferroni post hoc test was used for statistical analyses. **P < 0.01 and ***P < 0.001 versus WT group; ## P < 0.01 and ### P < 0.001 versus IL‐10 KO group.
-
B, CLength of colons from WT, SNX10 cKO, IL‐10 KO, and SNX10 cKO IL‐10 KO mice was measured (B) and analyzed (C) at the 16th week.
-
DClinical score was evaluated every 2 weeks from the 4th week to the 16th week. Data are means ± SD. One‐way ANOVA followed by Bonferroni post hoc test was used for statistical analyses. ***P < 0.001 versus WT group; ### P < 0.001 versus IL‐10 KO group.
-
E, FRepresentative H&E images of colon tissues of WT, SNX10 cKO, IL‐10 KO, and SNX10 cKO IL‐10 KO mice at the 16th week were shown (E) and analyzed (F). Scale bar: 100 μm.
-
GThe content of TNF‐α, IL‐6, IL‐12/IL‐23 p40, and IL‐17A in the serum of WT, SNX10 cKO, IL‐10 KO, and SNX10 cKO IL‐10 KO mice at the 16th week were measured by ELISA.
-
HThe relative mRNA levels of Tnf, Il6, Il23a, and Il17a in colon epithelial tissues of WT, SNX10 cKO, IL‐10 KO, and SNX10 cKO IL‐10 KO mice at the 16th week were measured.
-
IRepresentative immunohistochemistry images of E‐cadherin, Snail and Slug in colon tissues from WT, SNX10 cKO, IL‐10 KO, and SNX10 cKO IL‐10 KO mice at the 16th week were shown. Scale bar: 100 μm.
-
JProtein expression of E‐cadherin, p‐Lyn, and Lyn in colon epithelial tissues was determined by immunoblots.
-
KThe relative mRNA levels of Cdh1 (encoding E‐cadherin) in colon epithelial tissues were measured.
-
LThe gut permeability in vivo was evaluated using FITC‐dextran.
Data information: In (C and F–L), data are means ± SD. One‐way ANOVA followed by Bonferroni post hoc test was used for statistical analyses. *P < 0.05; **P < 0.01; ***P < 0.001.
Source data are available online for this figure.