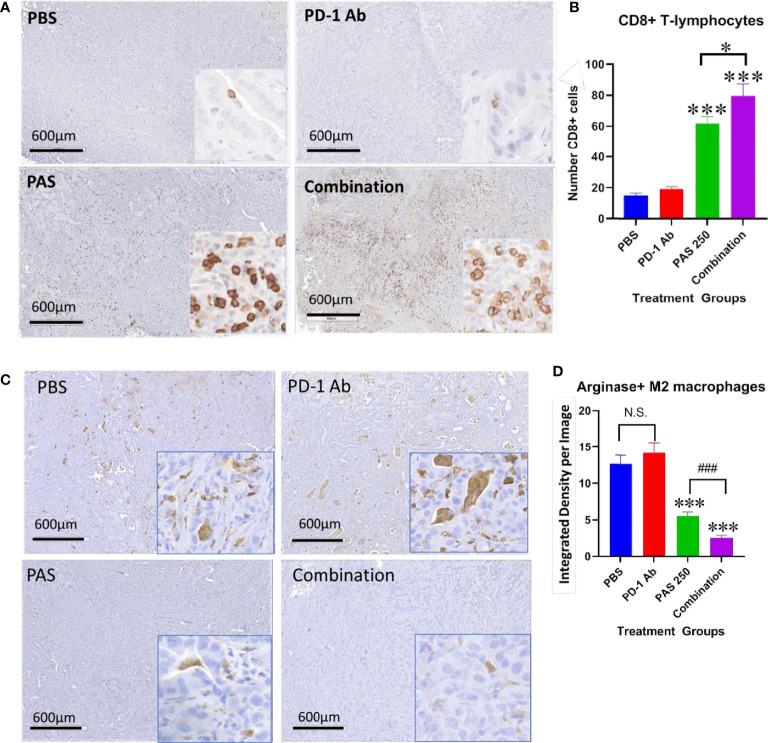
Figure 5.
PAS monotherapy and in combination with PD-1 Ab alter the tumor immune cell signature. (A) Representative low magnification tumor from each treatment or control group (scale bar 600µm) and a higher magnification (20×; Box insert) of tumors stained with an antibody for CD8+ T-lymphocytes. (B) Columns represent the mean ± SEM of the number of CD8+ immunoreactive cells in sections of YTN tumors from each group. PAS monotherapy and in combination with a PD-1 Ab significantly increase the number of CD8+ immunoreactive T-cells in the YTN tumors compared to tumors of PBS-treated mice. The combination of PAS with PD-1 Ab also markedly increased the number of CD8+ cells compared to PAS monotherapy. (***P <0.001 compared to PBS; ###P <0.001, compared to PAS). (C) Representative low magnification tumor from each treatment or control group (scale bar 600µm) and a higher magnification (20X; Box insert) of tumors stained with and antibody for M2-polarized tumor-associated macrophages (TAMs). (D) Columns represent the mean ± SEM of integrated density from ImageJ analysis for concentration of M2-polarized TAMs. The number of TAMs decreased significantly in tumors of mice treated with PAS monotherapy or in combination with the PD-1 Ab. Analysis showed that the combination therapy reduced TAMs significantly more than PAS alone. (***P<0.001 compared to PBS; ### P<0.001, compared to PAS). NS, not significant.

