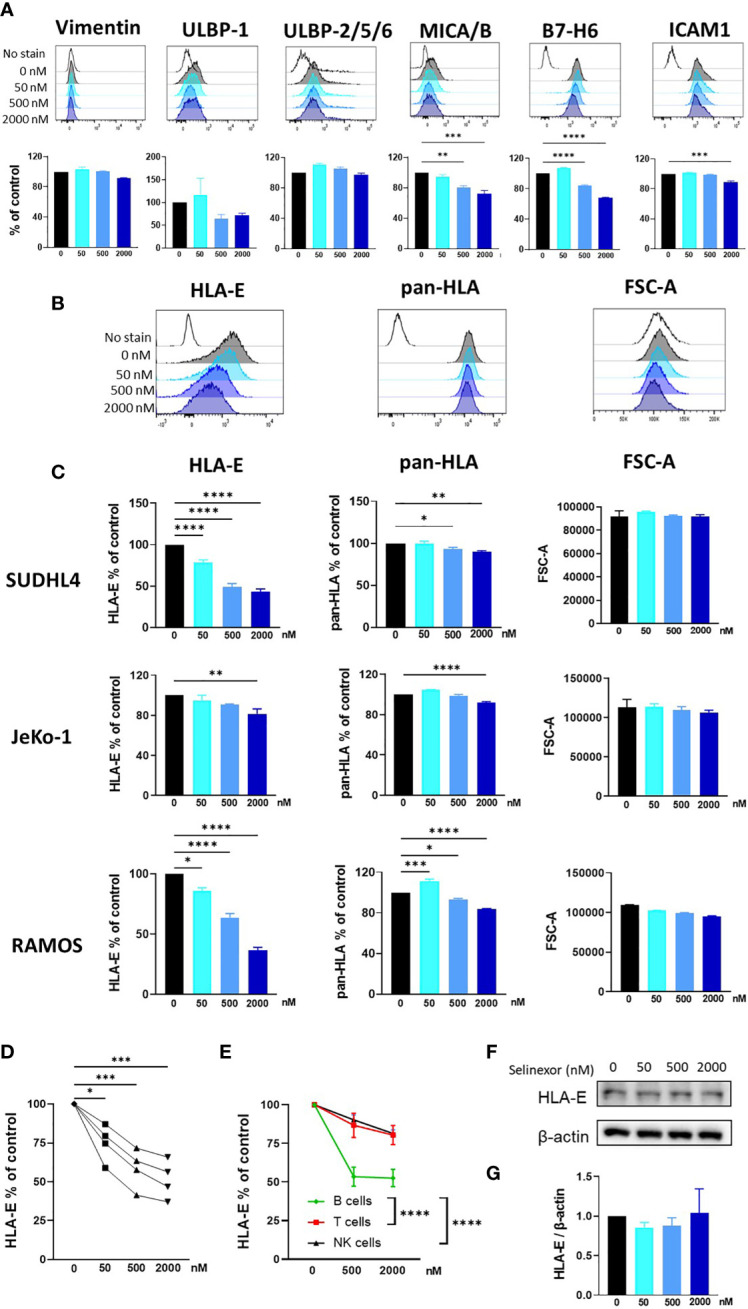
Figure 2.

Selinexor decreases the surface expression of HLA-E on malignant B cells. (A) SUDHL4 cells were incubated for 16hrs with selinexor at indicated concentrations or DMSO control in the presence of the caspase inhibitor QVD then assessed for surface expression of Vimentin, ULBP-1, ULBP-2/5/6, MICA/B, B7-H6 and ICAM1 by flow cytometry. Representative data and summarized data as % of control is shown from three independent experiments. (B, C) SUDHL4, JeKo-1, and RAMOS cells were incubated for 16hrs with selinexor at indicated concentrations or DMSO control in the presence of the caspase inhibitor QVD then assessed for surface expression of HLA-E (clone 3D12), class-I HLA proteins (pan-HLA, clone W6/32) and cell size as measured by the FSC-A parameter. Representative histograms of SUDHL4 cells are shown in (B) and summarized data mean ± SEM of SUDHL4 (n=8), JeKo-1 (n=5) and RAMOS (n=3) cells are shown in (C). Data was analysed using one-way ANOVA followed by Dunnett’s post-hoc test analysis: *P < 0.05, **P < 0.01, ***P < 0.005, ****P < 0.0001. (D) Primary CLL cells were incubated for 40hrs with selinexor at indicated concentrations or DMSO control in the presence of the caspase inhibitor QVD then CD5+CD19+ CLL cells were assessed for surface expression of HLA-E (clone 3D12). Shown is HLA-E % of DMSO control from four different CLL patient samples. Data was analysed using one-way ANOVA followed by Dunnett’s post-hoc test analysis: *P < 0.05, ***P < 0.005. (E) Healthy human PBMC were incubated with selinexor (500-2000nM) or DMSO control for 16hrs then assessed for surface expression of HLA-E (clone 3D12) on B cell, T cell and NK cell populations. Summarized data as HLA-E % of control is shown from six different donors. Data was analysed using two-way ANOVA: ****P < 0.0001. (F, G) SUDHL4 cells were incubated for 16hrs with selinexor at indicated concentrations or DMSO control in the presence of the caspase inhibitor QVD. HLA-E and β-actin protein levels were then detected by immunoblotting. Representative images are shown in (F) and summarized data mean ± SD protein band intensity relative to β-actin (n=2) is shown in (G).
